
On 17 March 2026, the India crude basket, released daily by the Petroleum Planning and Analysis Cell under the Ministry of Petroleum and Natural Gas, was priced at $146.09 per barrel. At the same time, most headlines placed Brent crude closer to the $100–110 range, creating a noticeable gap of nearly $40–50.
At first glance, this difference may appear concerning, raising questions about whether India is paying more than it should. The reality is that the India crude basket is not Brent. It is the benchmark that directly influences domestic fuel prices, government finances, oil marketing company margins, and even the Reserve Bank of India’s inflation outlook.
Understanding this gap requires a closer look at how the India crude basket is built, why it moves differently, and what it truly signals for the economy, investors, and crude oil trading strategies.
India Crude Basket
India Crude Basket (ICB) is a benchmark representing the weighted average price of international crude oil grades that India imports.
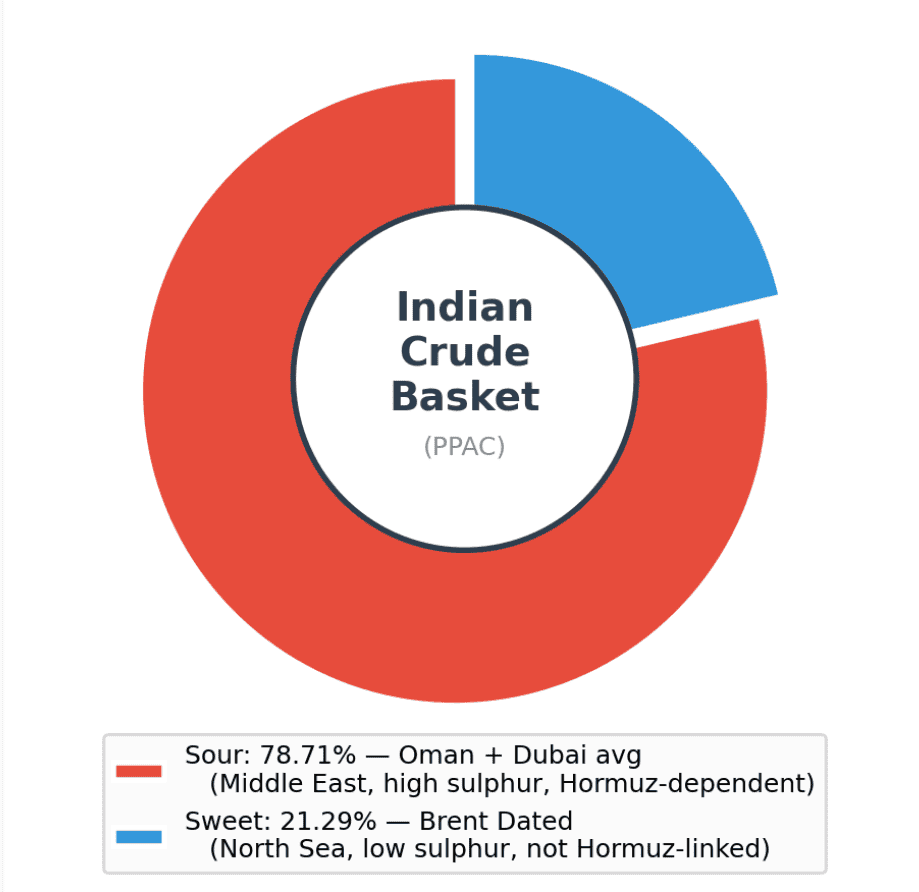
Indian refineries are designed to handle a specific type of crude mix. Around 78.71% of India’s oil is sour crude, which has higher sulphur content and mainly comes from the Middle East, including countries such as Saudi Arabia, Iraq, Kuwait, the UAE, and Oman. The remaining 21.29% is lighter, low-sulphur crude, similar to Brent.
To reflect this reality, the Petroleum Planning and Analysis Cell (PPAC) creates the India crude basket based on what India actually buys and refines, not on prices seen in global trading hubs such as London or New York.
These proportions are based on the actual share of high-sulphur and low-sulphur crude processed by Indian refineries, making the basket a realistic measure of India’s crude costs rather than a global reference like Brent.
How India Crude Basket is Calculated
Let us see how the India crude basket is calculated, a process that also supports a practical crude oil trading strategy:
| Step-1 | Crude composition | The basket price is calculated as a weighted average of different crude oil benchmarks, mainly: High sulphur-sour crude and Brent-sweet crude. |
| Step-2 | Take daily global prices | The prices of Oman, Dubai, and Brent crude are tracked daily from international markets. |
| Step-3 | Weighted average formula | Then the prices are multiplied by their respective weights and combined to arrive at a single basket price for the day. ICB Price = (Price of sour crude × its share) + (Price of sweet crude × its share) |
| Step-4 | Daily publication | The final number is published every day by the PPAC, making it a real-time indicator of India’s crude import cost. |
Why India Crude Basket Matters for Traders & Investors?
The India crude basket acts as a real-time signal of cost pressures, inflation trends, and market sentiment within the Indian economy. The traders and investors track this benchmark alongside crude oil technical analysis to make more informed and relevant decisions.
- True cost of imports: The India crude basket shows the actual price India pays for crude oil, which can be higher than global benchmarks like Brent.
- Inflation impact: When the basket price rises, fuel becomes more expensive, which increases overall inflation in the economy.
- Effect on oil companies: Higher crude prices can reduce the profits of companies such as Indian Oil Corporation, Hindustan Petroleum Corporation Limited, and Bharat Petroleum Corporation Limited.
- Economic signal: An increase in the basket raises the import bill of India and affects government finances and policy decisions.
- Geopolitical risk: India depends heavily on Middle East oil, so any disruption near the Strait of Hormuz can push prices higher.
Factors Affecting India Crude Basket Prices
Here are some key factors that influence the movement of India crude basket prices, which are also important for effective crude oil market timing:
- Geopolitical tensions: The conflicts in oil-producing regions, especially near the Strait of Hormuz, can disrupt supply and push prices higher, particularly for sour crude.
- Currency movements: Since crude oil is priced in US dollars, a weaker Indian rupee makes imports more expensive even if global prices remain unchanged.
- Import mix: The basket depends on the share of sour and sweet crude India buys, so changes in Oman, Dubai, or Brent prices directly affect the overall cost.
- Global demand and supply: The lower global oil supply or higher demand increases prices, while excess supply tends to bring prices down.
Trading & Investment Insights Using Crude Basket Trends
The rise in the India Crude Basket during March 2026 highlights how cost pressures can build and affect market decisions.
| Track the shift from discount to premium: | In January, India was buying crude at a 6.1% discount to Brent, but by March 17, it was paying a 33-46% premium, showing a clear reversal in cost advantage. |
| Watch how fast the spread widens: | The gap moved from –$4.40 in January to +$36-46 by mid-March, signalling sudden stress in supply and a spike in real import costs. |
| Link price spikes to geopolitical events: | As supply through the Strait of Hormuz tightened, Oman and Dubai crude surged above $150 per barrel, pushing India’s basket to $146. |
| Identify divergence from global benchmarks: | While Brent stayed near $100-110, India’s basket rose much faster, indicating that global prices alone may not reflect India-specific risks. |
| Translate trends into market impact: | Such sharp increases in the basket can raise inflation, weaken corporate margins, and influence interest rate expectations, making it a key signal for trading decisions. |
Risk Management & Common Mistakes
In practice, effective risk management involves tracking the India crude basket alongside global indicators, currency movements, and geopolitical developments to build a more balanced market view.
- Avoid relying only on Brent prices: Many traders might track only Brent, which can be misleading for India-focused decisions. The India crude basket moves differently, especially during regional disruptions.
- Consider currency risk: Crude is priced in US dollars, so a weaker rupee increases import costs even if oil prices are stable. This adds an extra layer of risk for investors.
- Consider geopolitical concentration: India depends heavily on Middle Eastern supply routes such as the Strait of Hormuz, making prices vulnerable to sudden disruptions.
- Involve hedging strategies: Ignoring tools such as commodity futures or diversification can increase risk. Traders often fail to protect portfolios against sudden crude price swings.
Final Thoughts
The India crude basket offers a view of the country’s real oil costs than global benchmarks alone. Its movement reflects not just price trends, but supply risks, currency shifts, and economic pressure.
This is tracked by the traders and investors, so that they can improve their judgement, sharpen timing, and align decisions more closely with India’s market realities.
FAQs
The India crude basket is the average price of crude oil that India imports, based on a mix of sour and sweet crude. It reflects the actual cost India pays for oil rather than global benchmark prices.
Brent crude is a global benchmark based on North Sea oil, while the India crude basket represents the specific mix of crude India imports. This makes the basket more relevant for understanding India’s fuel costs and economic impact.
The India crude basket price is published daily by the Petroleum Planning and Analysis Cell, which operates under the Ministry of Petroleum and Natural Gas.
Fuel prices in India are linked to the cost of imported crude oil. When the basket price rises, refining becomes more expensive, which often leads to higher petrol and diesel prices.
Retail investors can trade crude oil indirectly through commodity exchanges such as the Multi-Commodity Exchange of India using futures contracts, though it involves risk and requires an understanding of price movements.
Beginners can track crude oil trends by following daily updates from the Petroleum Planning and Analysis Cell, monitoring global benchmarks like Brent, and watching key factors such as currency movements and geopolitical developments.