
As India’s mobility ecosystem expands, from passenger vehicles and two-wheelers to commercial logistics and exports, tyre manufacturers stand at the core of this transformation. CEAT Ltd has steadily evolved into one of India’s leading tyre brands, balancing OEM relationships, replacement market strength, and export diversification. With improving product mix and focus on premiumisation, CEAT is positioning itself for sustainable growth in a competitive industry.
But does CEAT Ltd. offer a compelling case for long-term investors? Let’s delve deeper.
Stock overview
| Ticker | CEATLTD |
| Industry/Sector | Automobile & Ancillaries |
| CMP | 3965.30 |
| Market Cap (₹ Cr.) | 15,559 |
| P/E | 29.17 (Vs Industry P/E of 28.79) |
| 52 W High/Low | 4438.00 / 2343.05 |
| EPS (TTM) | 136.49 |
| Dividend Yield | 0.75% |
About CEAT Ltd.
CEAT Ltd, part of the RPG Group, is a major Indian tyre manufacturer serving domestic and international markets. The company offers tyres across passenger vehicles, two-wheelers, commercial vehicles, and specialty segments. Over the years, CEAT has strengthened its brand positioning, invested in capacity expansion, and built strong OEM relationships while maintaining a dominant presence in the replacement market.
Key business segments
CEAT Ltd. operates primarily in the following key business segments:
- Passenger Vehicle Tyres: Radial tyres for cars and SUVs.
- Two & Three-Wheeler Tyres: Market leadership in select sub-segments.
- Commercial Vehicle Tyres: Truck and bus radials catering to logistics demand.
- Off-Highway & Specialty Tyres: Agriculture, earthmovers, and niche industrial tyres.
- Exports: Sales across Europe, Middle East, Africa, and Latin America.
Primary growth factors for CEAT Ltd.
CEAT Ltd. key growth drivers:
- Auto Sales Growth: Rising passenger vehicle and two-wheeler penetration.
- Replacement Market Strength: High-margin replacement demand remains resilient.
- Premiumisation: Increasing share of larger rim sizes and high-performance tyres.
- Capacity Expansion: Ongoing investments to enhance production capabilities.
- Export Diversification: Growing presence in global markets.
Detailed competition analysis for CEAT Ltd.
Key financial metrics – TTM;
| Company | Sales (₹ Cr.) | EBITDA (₹ Cr.) | EBITDA Margin (%) | PAT (₹ Cr.) | PAT Margin (%) | P/E |
| CEAT Ltd. | 14879.73 | 1842.54 | 12.38% | 536.28 | 3.60% | 29.17 |
| MRF Ltd. | 30179.66 | 4675.01 | 15.49% | 2230.05 | 7.39% | 28.74 |
| Balkrishna Industries Ltd. | 10642.64 | 2273.98 | 21.37% | 1312.19 | 12.33% | 38.88 |
| Apollo Tyres Ltd. | 27558.51 | 3911.81 | 14.19% | 925.43 | 3.36% | 34.21 |
| JK Tyre & Industries Ltd. | 15861.81 | 1857.39 | 11.71% | 688.86 | 4.34% | 24.12 |
Key insights on CEAT Ltd.
- Balanced Revenue Mix: Healthy combination of OEM and replacement business.
- Margin Sensitivity: Rubber and crude derivatives impact profitability.
- Brand Positioning: Strong recall supports pricing power.
- Operating Leverage: Capacity utilisation improves margins in growth cycles.
- Competitive Industry: Market share dynamics influenced by pricing and innovation.
Recent financial performance of CEAT Ltd. for Q3 FY26
| Metric | Q3 FY25 | Q2 FY26 | Q3 FY26 | QoQ Growth (%) | YoY Growth (%) |
| Sales (₹ Cr.) | 3673.68 | 4011.31 | 4222.96 | 5.28% | 14.95% |
| EBITDA (₹ Cr.) | 314.22 | 521.38 | 570.79 | 9.48% | 81.65% |
| EBITDA Margin (%) | 8.55% | 13.00% | 13.52% | 52 bps | 497 bps |
| PAT (₹ Cr.) | 57.37 | 222.55 | 209.05 | -6.07% | 264.39% |
| PAT Margin (%) | 1.56% | 5.55% | 4.95% | -60 bps | 339 bps |
| Adjusted EPS (₹) | 1.92 | 8.08 | 7.21 | -10.77% | 275.52% |
CEAT Ltd. financial update (Q3 FY26)
Financial performance
- Revenue up 15% YoY to ₹4,223 Cr, led by 15% volume growth across segments and recovery in replacement and OEM demand.
- EBITDA grew 82% YoY to ₹571 Cr; margins expanded 497 bps YoY to 13.5%, supported by benign input costs and operating leverage.
- Adjusted PAT increased 264% YoY to ₹209 Cr.
- Gross margins expanded 310 bps YoY on lower raw material costs.
- 9MFY26 revenue up 18% YoY; EBITDA margins improved to 13% vs 11% in FY25, driven by better mix and cost control.
Business highlights
- The replacement segment recorded mid-teens growth, led by strong demand in passenger car and two-wheeler tyres.
- The OEM segment grew in the 20s, with strong traction in passenger vehicles, farm equipment, and select CV sub-segments.
- International business grew in the 20s, with strong demand across Europe, LATAM, Africa, Canada, and Australia.
- Camso revenue stood at USD20m (₹180 Cr); adjusted operating margins were already in low double digits despite the transition phase.
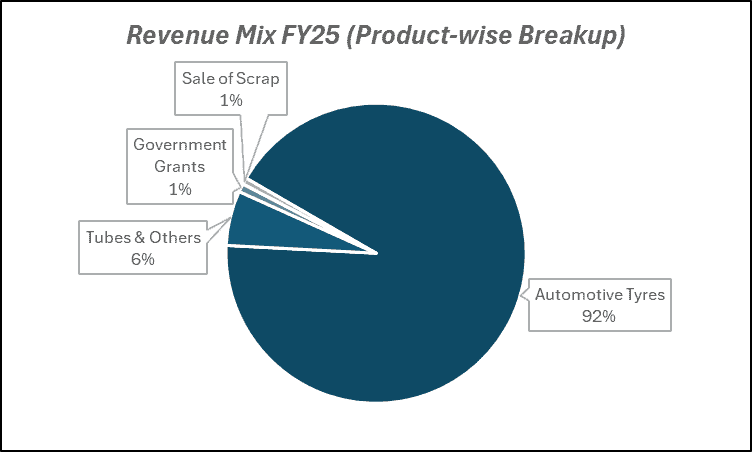
- Product mix (9MFY26): Truck/Bus 29%, 2/3W 27%, PV 22%, OHT 15%, Others 7%.
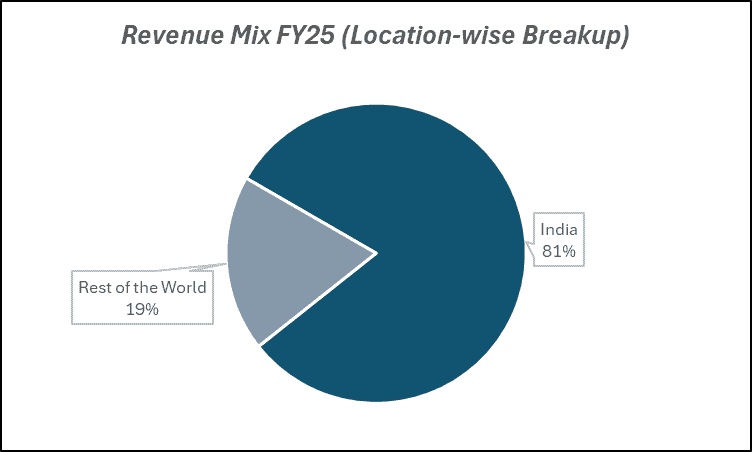
- Market mix (9MFY26): Replacement 52%, OEM 29%, Exports 19%.
Outlook
- Domestic tyre demand is expected to grow in high single digits over the medium term, supported by premiumization and EV penetration.
- Sequential raw material cost increase of 1-1.5% guided for 4Q due to currency depreciation and rubber price uptick.
- Camso margins are expected to improve toward 20%+ as utilization ramps up and integration stabilizes over the next 3–5 quarters.
- Capex guidance for FY26 at ₹10 Cr (ex-Camso intangibles); ₹1,300 Cr approved for Chennai plant expansion (3.5m additional PC tyre capacity by 2HFY28).
- Leverage remains comfortable with Debt/EBITDA 1.5x; improving profitability and cash flows support earnings visibility.
Recent Updates on CEAT Ltd.
- Capacity Enhancement: Investments in advanced radial tyre production.
- EV-Ready Products: Launch of tyres designed for electric vehicles.
- Brand Campaigns: Increased marketing to strengthen premium image.
- Export Expansion: Entry into newer geographies and strengthening distribution networks.
- Sustainability Initiatives: Efforts to reduce carbon footprint and adopt eco-friendly manufacturing.
Company valuation insights – CEAT Ltd.
CEAT Ltd is currently trading at a TTM P/E of 29.17x, broadly in line with the industry average of 28.79x. Over the last one year, the stock has delivered a strong 50% return, significantly outperforming the NIFTY 50’s 10.6% gain. While valuations are not inexpensive on an absolute basis, the re-rating reflects improving demand conditions, margin recovery, and stronger earnings visibility supported by operating leverage and portfolio mix improvement.
The investment case for CEAT is anchored in cyclical recovery supported by structural drivers. In Q3FY26, revenue grew 15% YoY to ₹4,223 Cr, led by healthy volume growth across replacement, OEM, and exports. EBITDA margins expanded 497 bps YoY to 13.5%, supported by benign input costs and improved product mix. The replacement segment recorded mid-teens growth, OEM demand grew in the 20s, and international business also expanded strongly across key geographies.
Additionally, GST-led demand revival, premiumisation across segments, and increasing EV penetration (with strong market share in PV and 2W EV tyres) provide medium-term growth tailwinds. The Camso acquisition, currently in transition, is already delivering low double-digit operating margins and is expected to scale toward 20%+ margins as utilization improves over the next few quarters. Capacity expansion at the Chennai plant, improving capacity utilization (80-85%), and disciplined leverage (Debt/EBITDA 1.5x) further strengthen earnings visibility.
From a valuation standpoint, applying a 20x multiple to FY27E EPS of ₹245, we arrive at a 12-month target price of ₹4,900, implying an upside potential of 24% from current levels. Over the near term, we assign a 3-month target price of ₹4,200, indicating a 6% upside, supported by sustained demand recovery, margin resilience despite modest raw material headwinds, and continued traction in exports and premium segments.
Major risk factors affecting CEAT Ltd.
- Raw Material Volatility: Natural rubber and crude-linked inputs affect margins.
- Auto Demand Slowdown: Weak vehicle sales can impact OEM volumes.
- Pricing Pressure: Intense competition in both domestic and export markets.
- Currency Risk: Export exposure leads to forex sensitivity.
- Capacity Utilisation Risk: Underutilisation during downturns impacts profitability.
Technical analysis of CEAT Ltd. share
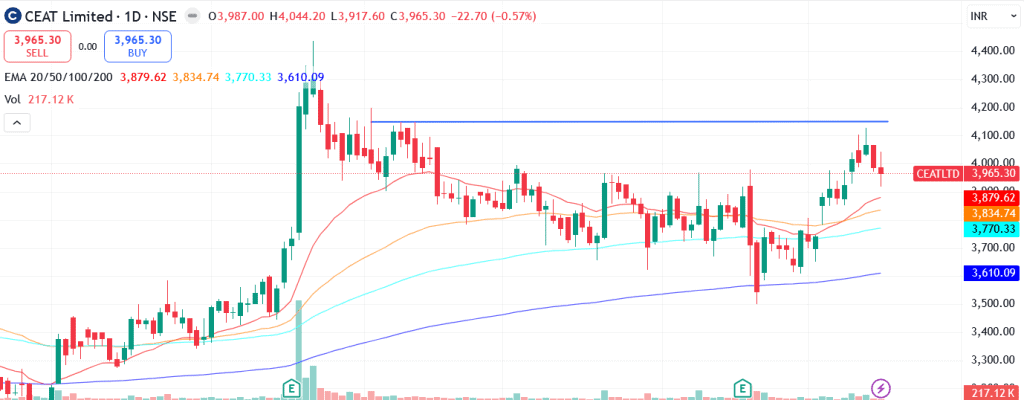
CEAT Ltd is currently forming a rounding bottom pattern, indicating a gradual shift from accumulation to potential trend reversal. Prices are still approaching the neckline of the formation, and a decisive breakout above this level could significantly strengthen the bullish case and confirm the transition into a sustained uptrend.
Importantly, the stock is trading above its 20-, 50-, 100-, and 200-day EMAs, reflecting strong structural alignment across timeframes. This positioning suggests that the broader trend has turned positive, with moving averages acting as dynamic support zones on any short-term pullbacks.
Momentum indicators reinforce the constructive setup. MACD at 57.60 remains firmly in positive territory and is trading above the signal line, indicating sustained bullish momentum. RSI at 58.23 reflects strong buying interest without entering overbought territory, leaving room for further upside. Relative RSI at 0.03 over both 21-day and 55-day periods signals outperformance versus the broader market, suggesting improving relative strength. ADX at 18.83 indicates that trend strength is gradually building, supporting the possibility of a breakout-led move.
A sustained move above ₹4,200 (neckline zone) could trigger fresh momentum and open the path towards ₹4,900, aligning with the 12-month fundamental target. On the downside, ₹3,700 remains a key support level; holding above this zone preserves the rounding bottom structure and limits downside risk.
- RSI: 58.23 (Bullish; strong buying interest)
- ADX: 18.83 (Trend strength building)
- MACD: 57.60 (Positive; above signal line)
- Resistance: ₹4,200
- Support: ₹3,700
CEAT Ltd. stock recommendation
Current Stance: Buy, with a 3-month target of ₹4,200 (6% upside) and a 12-month target of ₹4,900 (24% upside), based on 20x FY27E EPS of ₹245.

Why buy now?

Recovery in replacement and OEM demand, supported by GST-led revival and improving auto cycle.

Strong margin expansion trajectory driven by benign input costs, better product mix, and operating leverage.

Premiumisation across segments and rising share in EV tyres enhancing structural growth visibility.

Camso acquisition offers medium-term margin accretion as utilization scales toward 20%+ levels.

Disciplined balance sheet management with improving leverage ratios and capacity expansion supporting future growth.

Portfolio fit

CEAT Ltd provides exposure to India’s auto cycle recovery and infrastructure-led demand, combining cyclical upside with improving structural profitability. With margin recovery, expanding export presence, premium product mix, and operating leverage benefits, the stock fits well in portfolios seeking earnings acceleration, manufacturing exposure, and diversification alongside consumption or defensive allocations.
If you found this helpful and want regular stock trade calls, check out my community on StockGro here: https://app.stockgro.club/ui/social/tradeViews/groupFeed/07a7b961-b8ca-42ce-baf3-a9eec781b6ebCEAT Ltd.: Budget 2026-27 opportunities
- Infrastructure & Logistics Spend: Higher freight movement boosts commercial tyre demand.
- EV Adoption Push: Incentives for electric vehicles increase demand for EV-specific tyres.
- Manufacturing Incentives: Support for domestic auto and component production.
- Export Promotion: Trade facilitation and FTA benefits aid overseas growth.
- Rural Income Support: Higher farm incomes drive tractor and two-wheeler tyre demand.
Final thoughts
CEAT represents a mobility-linked cyclical with structural growth undercurrents. While margins fluctuate with commodity cycles, its diversified portfolio, strong brand equity, and growing premium mix provide resilience. For investors seeking exposure to India’s expanding auto ecosystem and replacement-driven cash flows, CEAT offers a blend of cyclical recovery potential and long-term mobility participation.