- Summary
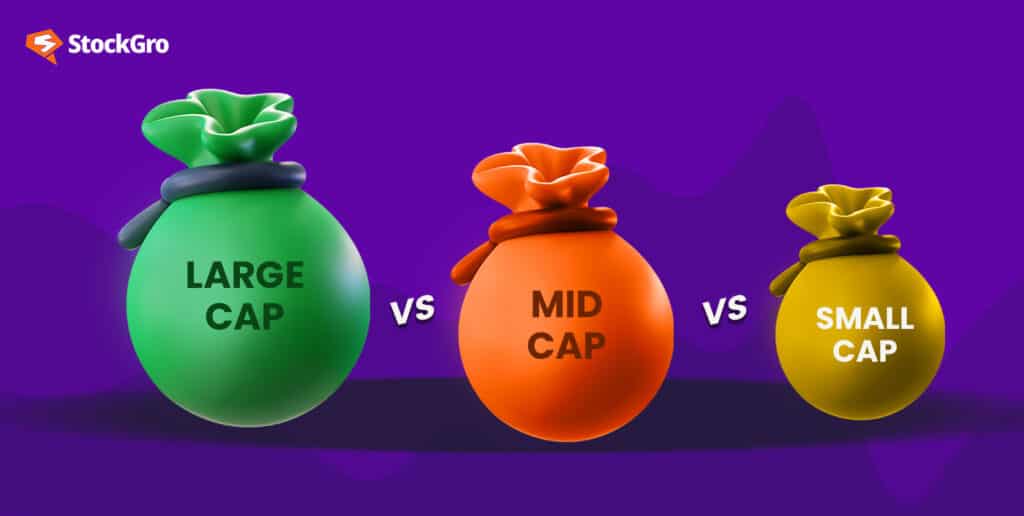
- The differences between large-cap, mid-cap, and small-cap stocks primarily lie in company size, risk level, liquidity, and growth potential. According to the SEBI classification, large-cap companies are those ranked from 1st to 100th, mid-cap companies from 101st to 250th, and small-cap companies from 251st onwards, with the ranking based on total market capitalisation.
- Stocks of large companies tend to have lower volatility and greater liquidity, making them more appropriate for investors seeking relative stability.
- Stocks in the mid-cap and small-cap categories have greater growth potential but usually entail more volatility and risk.
- Large-cap stocks are usually appropriate for investors with a low risk appetite, whereas medium- and small-cap stocks are more suitable for investors with a higher risk tolerance and a longer investment horizon.
Companies are divided into large-cap, mid-cap, and small-cap stocks according to their rank based on total market capitalisation. The main differences among the three categories lie in company size, risk level, liquidity, and growth potential, so knowing these differences can help investors select stocks that suit their objectives and risk tolerance.
What is market capitalisation?
Market capitalisation is the total market value of all the shares of a company that are currently outstanding. It is worked out using the formula below:
Market capitalisation = Share price × Outstanding shares
SEBI classifies companies according to their rank by full market capitalisation:
| Category | SEBI classification |
| Large cap | 1st to 100th company |
| Mid cap | 101st to 250th company |
| Small cap | 251st company onwards |
AMFI compiles the list of companies for this classification and updates it every six months based on market data from the ends of June and December.
The rupee value assigned to each category is not a fixed threshold, as companies’ market cap are subject to change. When the AMFI classification was prepared for the period January to June 2026, the 100th and 101st companies had market capitalisations of about ₹1.06 lakh crore, and the 250th and 251st companies had market capitalisations of about ₹33,000 crore. These figures serve as reference points for that particular classification period and are not permanent SEBI bands.
What are large-cap stocks?
Large-cap stocks are those of companies ranked from first to hundredth by their total market capitalisation, as classified by SEBI. These are usually the largest and most established of the listed companies.
Large-capitalisation shares are generally more stable and more liquid than those of smaller companies, and some of the well-known large-cap companies do pay dividends, although dividend payments are not guaranteed.
Examples of Large Cap Companies
Reliance Industries is one of the large-cap companies listed by AMFI for the period January to June 2026 and ranked first in that group based on average full market capitalisation.
What are mid-cap stocks?
Mid-cap stocks are shares in companies ranked between the 101st and 250th by total market capitalisation, and thus lie between large-cap and small-cap companies in terms of size.
Mid-cap companies may have greater growth potential than large companies, but their share prices may also be more volatile, and their liquidity can be lower than that of large-cap stocks.
Examples of Mid Cap Companies
In the AMFI classification for the period January to June 2026, Bosch ranked 101st, placing it in the mid-cap category.
What are small-cap stocks?
Small-cap stocks are the shares of companies ranked 251st and below by total market capitalisation; they are smaller than those in the large-cap and mid-cap categories.
Although small-cap stocks have a greater potential for growth, they usually involve higher levels of volatility and liquidity risk, and their performance can be more affected by changes in business conditions and market sentiment.
Examples of Small Cap Companies
In the AMFI classification for the period January to June 2026, Navin Fluorine International came 251st and thus occupied the top position in the small-cap category for that time.
Large Cap vs Mid Cap vs Small Cap: comparison table
| Feature | Large Cap | Mid Cap | Small Cap |
| Market-cap rank | 1st to 100th | 101st to 250th | 251st onwards |
| Risk & volatility | Generally lower | Generally moderate to high | Generally higher |
| Growth potential | Relatively moderate | Higher | Higher, with greater uncertainty |
| Returns | Generally more stable | Higher potential with higher volatility | Higher potential with higher volatility |
| Liquidity | Generally higher | Generally moderate | Generally lower |
| Stability | Generally higher | Moderate | Generally lower |
| Ideal investor | Investors seeking relative stability | Investors comfortable with moderate to high risk | Investors comfortable with higher risk |
| Investment horizon | Long term | Long term | Long term |
The market-cap category is determined by ranking, meaning a company can shift from one category to another if its relative market capitalisation changes.
Which should you invest in?
No single category is suitable for all investors; when choosing among large-cap, mid-cap, and small-cap stocks, one’s objectives, risk tolerance, and investment horizon must be taken into account.
When relative stability is your main aim, large-cap stocks are usually the more appropriate choice, as they are from the largest companies and generally have greater liquidity.
If you are looking for a combination of size and growth, mid-cap stocks offer exposure to companies smaller than large-cap stocks while providing greater growth potential.
Small-cap stocks may offer greater growth opportunities if you are willing to accept higher risk, but their prices may also be more volatile.
How to identify a stock’s market-cap category
The simplest method of determining whether a share is classified as large-cap, mid-cap or small-cap is to refer to the most recent AMFI categorisation list, which is published by AMFI based on total market capitalisation in accordance with the SEBI classification.
The current framework is:
- Large cap: 1st to 100th company
- Mid cap: 101st to 250th company
- Small cap: 251st company onwards
The list is revised every six months based on market data collected at the end of June and December.
For instance, in the list covering the period from January to June 2026 Reliance Industries was ranked first, Bosch came in at position 101 and Navin Fluorine International was at rank 251.
You shouldn’t determine a stock’s category by looking only at its share price, since a company’s market capitalisation depends on both the share price and the number of shares outstanding.
Large cap vs mid cap vs small cap mutual funds
The same is true for the large-cap, mid-cap, and small-cap categories when comparing equity mutual funds.
Under the SEBI framework, a large-cap fund is required to invest at least 80% of its total assets in companies classified as large-cap; a mid-cap fund mainly invests in mid-cap stocks; and a small-cap fund concentrates on small-cap companies.
The mutual fund classification currently in force by SEBI covers funds that invest across all market-capitalisation segments. For instance, a multi-cap fund must allocate at least 25% of its total assets to large-cap, mid-cap, and small-cap companies, provided that the relevant rules apply.
Investors interested in having a presence across all market-cap categories might also consider an all-cap fund.
While the fund category indicates what types of stocks the fund invests in, investors should still review the fund’s portfolio, costs, risk, and investment strategy before investing.
Which has given better returns? (historical performance)
It never happens that a particular market-capitalisation group delivers the highest returns in every phase, since the performance of the large-cap, mid-cap, and small-cap groups can vary with the market cycle and the period in question.
Broad-market indices provide a way to compare these different segments. For instance, the Nifty Midcap 100 indexes the mid-cap segment and recorded a five-year annualised total return of 20.71% as of 30 April 2026.
When assessing historical performance, it is necessary to use the same measurement period, date, and method of calculating returns; making a comparison that uses price returns for one index and total returns for another may lead to a misleading conclusion.
Previous performance also does not ensure future returns, and investors should take into account the risk that has been assumed in order to achieve the historical returns rather than selecting a category on the basis of its past performance alone.
FAQs
There is no single category that is best for every investor. Large caps generally suit investors seeking relative stability, mid caps can suit investors seeking a balance between company size and growth potential, and small caps can suit investors comfortable with higher risk and volatility.
Small-cap stocks are usually the riskiest of the three types, as they tend to have greater volatility and lower liquidity; mid-cap stocks are generally associated with a moderate to high level of risk, whereas large-cap stocks generally have considerably less volatility.
Check the latest AMFI stock categorisation list. Companies ranked 1st to 100th by full market capitalisation are large-cap; companies ranked 101st to 250th are mid-cap; and companies ranked 251st onwards are small-cap.
The rupee value of each category changes as company market capitalisations change. For the January to June 2026 AMFI classification, the boundary between large and mid cap was around ₹1.06 lakh crore, while the boundary between mid and small cap was around ₹33,000 crore. These are current reference values for that classification period, not permanent thresholds.
Market-cap category gives a broad indication of risk, but it does not determine the risk of an individual stock. A large-cap stock can still be risky because of factors such as valuation, debt, business performance and market conditions, while a smaller company can have stronger fundamentals.