In a world where successful traders and investors are always on the lookout for tools that give them an edge over others, the Moving Average Convergence Divergence, or MACD, indicator – is a technical powerhouse. Renowned for its uniqueness and versatility, the MACD is equally popular with both novice and experienced traders.
Unlike many other technical indicators, the MACD enables you to identify potential entry and exit points, gauge market momentum, and even spot potential reversals.
In this article, we will delve into the intricacies of the MACD indicator, unravelling its secrets and providing you with the insights needed to harness its power effectively. Whether you’re a seasoned pro or just starting your journey in the world of finance, understanding how to utilise the MACD settings could be the key to taking better trades.
What is MACD in Stock Market
The acronym stands for Moving Average Convergence Divergence. This indicator belongs to a class of other indicators known as momentum and trend-following indicators and was developed by Gerald Appel in the late 1970s. Even today, it is one of the most credible momentum filters in the trading world.
The concept behind the MACD is fairly straightforward. Essentially, it calculates the difference between a stock’s 26-day and 12-day exponential moving averages (EMA). In calculating their values, both moving averages use the closing prices of whatever period is measured.
At first glance, it might look like there’s too much going on with it. However, when you come to understand the different components of the indicator, you will most certainly start to interpret it intuitively.
Components of the MACD indicator
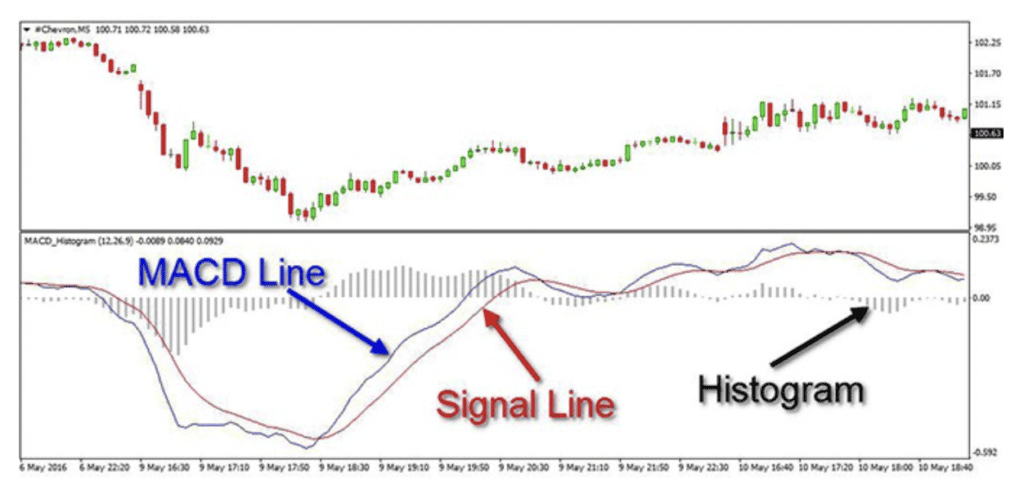
Primarily, this indicator consists of three main, individual components.
- The MACD line – The MACD Line is a faster-moving line and represents the difference (or distance) between two moving averages (usually a 12-period EMA and a 26-period EMA).
- The signal line – The signal line is the second crucial component of the MACD indicator. It indicates the 9-period EMA (default setting) of the MACD Line.
- The MACD histogram – The histogram is the difference between the MACD line and the Signal line.
How to Read MACD?
There are several ways to read the MACD depending on what you’re looking to get out of it. Here are some ways.
Crossovers
Crossovers are fundamental to interpreting the Moving Average Convergence Divergence (MACD) indicator. They play a crucial role in signalling potential shifts in market momentum and providing buy or sell signals. There are several types.
A bullish crossover occurs when the MACD line crosses above the signal line. It indicates that the stock price is on a potential shift from a bearish to a bullish trend. If it is already in a bullish trend, this could indicate more strength in the same movement.
In the same way, a bearish crossover occurs when the MACD line crosses below the signal line. Traders interpret this as a sell signal and usually consider this an appropriate time to enter into a short (sell) position.
While crossovers can be valuable signals, you must take care to use them in conjunction with other technical signals and not take them on their face value.
Histogram
The histogram in a MACD consists of vertical bars that are either above or below a central horizontal line, which is the zero line. When these histogram bars are above the zero line, the MACD line is above the signal line, which is a bullish sign.
Conversely, when the bars are below the zero line, it is suggestive of bearish momentum. The height or length of the bars represents the strength of the difference between the MACD line and the signal line.
There are several ways in which you can interpret the histogram:
- When the histogram bars are above the zero line and expanding in length, that is considered a positive (bullish) signal. This is a good time to enter into long positions with the stock. Conversely, when the histogram bars are above the zero line but contracting, it suggests that bullish momentum is weakening.
- When the histogram bars are below the zero line and expanding in length, it signifies increasing bearish momentum. The converse applies too.
How to use a MACD indicator
You can use MACD to make smarter choices like:
Spot trend changes — when the MACD crosses the signal line
Confirm trend strength — positive histogram = strong uptrend
Filter noise — MACD smooths price action
Combine with price action & support/resistance for cleaner signals
MACD works on daily, weekly, or even 5‑minute charts — but it’s most reliable on higher timeframes (like daily/weekly).
MACD Settings
The standard MACD settings are:
- 12 EMA (short‑term)
- 26 EMA (long‑term)
- 9 EMA (Signal line)
These default settings are popular because they balance responsiveness and reliability. However, traders can customize them depending on their time frame and trading strategy. For example:
Slower MACD (e.g. 19/39/9) → fewer signals, better clarityls
Longer settings → fewer false signals
Faster MACD (e.g. 8/17/9) → more signals but more noise
MACD with the RSI and SMA
It is also a popular practice to use the MACD in conjunction with the Relative Strength Index (RSI) and the Simple Moving Average (SMA).
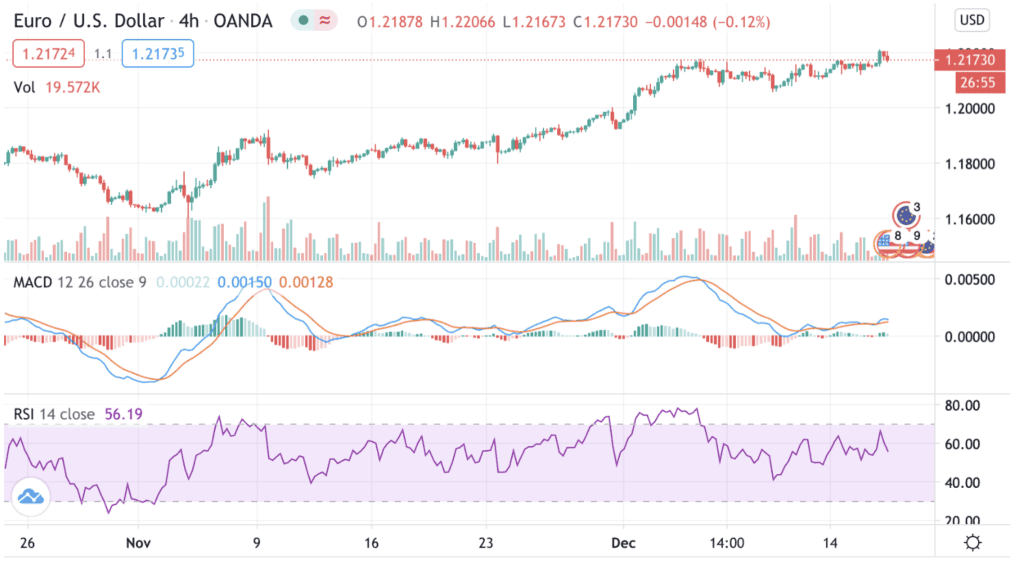
The RSI is an indicator that allows you to measure how strong a current trend is, while being able to accurately pinpoint points of reversal along the same trendline. The RSI uses a baseline of 14 periods with two reference levels – an overbought and an oversold level. Traditionally, these are 80 and 20, respectively.
At the same time, the SMA calculates the average range of price movement in the stock over the number of periods mentioned in the candlestick chart. This indicator helps you understand whether the current trend will continue or reverse.
A combination of these three indicators helps traders:
- Determine future price changes using the RSI
- Show how strong a trend is and where it’s headed using the MACD
- Use the SMA as a lagging trend-following indicator
Interpretations of MACD
MACD can be interpreted in multiple ways:
Signal Line Crossover
When the MACD line crosses the Signal line, traders interpret it as a momentum change:
- Bullish Crossover → potential buy
- Bearish Crossover → potential sell
Zero Line Crossover
Zero line acts as a baseline:
- MACD above zero → bullish market condition
- MACD below zero → bearish market condition
These crossovers are simple yet powerful signals that help traders time entries and exits.
Signal Line Crossover
One of the most widely used MACD signals:
Bullish Signal: MACD line crosses above the Signal line — suggests strengthening buying momentum and often signals an upward price move.
Bearish Signal: MACD line crosses below the Signal line — suggests increasing selling pressure and potential downward moves.
It works well in trending markets but can produce false signals in sideways ranges.
Zero Line Crossover
The zero line separates positive momentum from negative momentum:
- Above zero → Bullish: The short‑term EMA is above the long‑term EMA — buyers are in control.
- Below zero → Bearish: The short‑term EMA is below the long‑term EMA — sellers dominate.
Zero line crossovers can be powerful trend confirmation signals.
Limitation of MACD Indicator
One common issue with the Moving Average Convergence Divergence (MACD) indicator is that it can sometimes give a signal that suggests a price reversal is coming, but the reversal doesn’t actually happen.
This can be misleading. Another problem is that it tends to predict too many reversals that never really happen, and it misses some genuine price reversals.
To make sure you’re on the right track, you can use another indicator called the Average Directional Index (ADX) in combination with the MACD. The ADX is like a traffic light for trends. When it’s above 25, it means there’s a trend happening, either up or down. When it’s below 20, it means there’s no clear trend.
If you’re using the MACD and it shows a signal like a bearish divergence, it’s a good idea to check the ADX. If the ADX says there’s a strong upward trend, you might want to hold off on making a bearish trade based solely on the MACD. It helps you avoid making hasty decisions and gives you time to see how the market behaves over a few days.
Conclusion
In conclusion, despite the reverence of the MACD in the technical analysis world, you can see that it is best used with another indicator – whether that’s the RSI, the SMA, or even the ADX. Cross-referencing is the name of the game in technical analysis because it lets you increase your conviction in a trade.
FAQ’s
Crossovers:
Bullish Crossover: MACD line crosses above the Signal line → buy signal.
Bearish Crossover: MACD line crosses below the Signal line → sell signal.
Histogram:
Expanding bars: Increasing momentum.
Shrinking bars: Weakening momentum.
Zero Line:
Above zero: Bullish trend.
Below zero: Bearish trend.
Combine with Other Indicators: Use alongside RSI or SMA for better accuracy.
MACD Line: Difference between the 12-period and 26-period EMAs.
Signal Line: 9-period EMA of the MACD line.
Histogram: Shows the distance between MACD and Signal line.
Zero Line: Indicates trend strength:
Above zero → Bullish
Below zero → Bearish
It helps identify trend reversals and momentum shifts.