Here is something most traders figure out only after a string of bad trades: the problem was never the stock; it was the timing. The Exponential Moving Average (EMA) is one of those tools that gives you a cleaner read on where the price is going, when to get in, and when to step aside. This article covers the best EMA settings for swing trading, how to read them together, and what to avoid along the way.
What EMA Means in Trading
A moving average tracks the average closing price of a stock over a set number of periods and updates continuously as new data comes in. The EMA adds a layer of intelligence to that concept: recent prices carry more weight than older ones. So instead of treating last week’s close the same as yesterday’s, the EMA leans toward what just happened.
That weighting is what gives it an edge. The line stays closer to the current price, responds to shifts earlier, and does not drag behind the way a flat average often does. For traders trying to read a market that is moving right now, that responsiveness matters.
Why EMA Is Useful for Swing Trading
Swing trading sits in a sweet spot: you are not scrambling every hour like an intraday trader, but you are also not waiting months for a position to work out. For swing trading, EMA helps with:
- Trend Identification: Whether the price is sitting above or below the EMA tells you the prevailing direction at a glance. No complex calculation needed, just observe.
- Dynamic Support and Resistance: In trending conditions, prices have a tendency to pull back toward the EMA before continuing. The EMA becomes a live reference that moves with the market.
- Quicker Signals: As the EMA is weighted toward recent price data, it responds to directional shifts faster than its other counterparts, giving traders a head start.
- Versatility Across Markets: Whether it is stocks, commodities, or indices, the EMA reads price the same way regardless of the asset. The method transfers cleanly.
Best EMA Settings for Swing Trading
Not every EMA setting serves the same purpose. Each one operates on a different time horizon and tells a different story.
9 EMA
Think of the 9 EMA as the market’s pulse. It moves fast and reflects the short-term momentum accurately. The 9 EMA strategy involves pairing it with a slower EMA to filter out the noise, because on its own it tends to whipsaw in range-bound conditions.
Use it to confirm that momentum exists, not to decide whether the trade is worth taking.
20 EMA
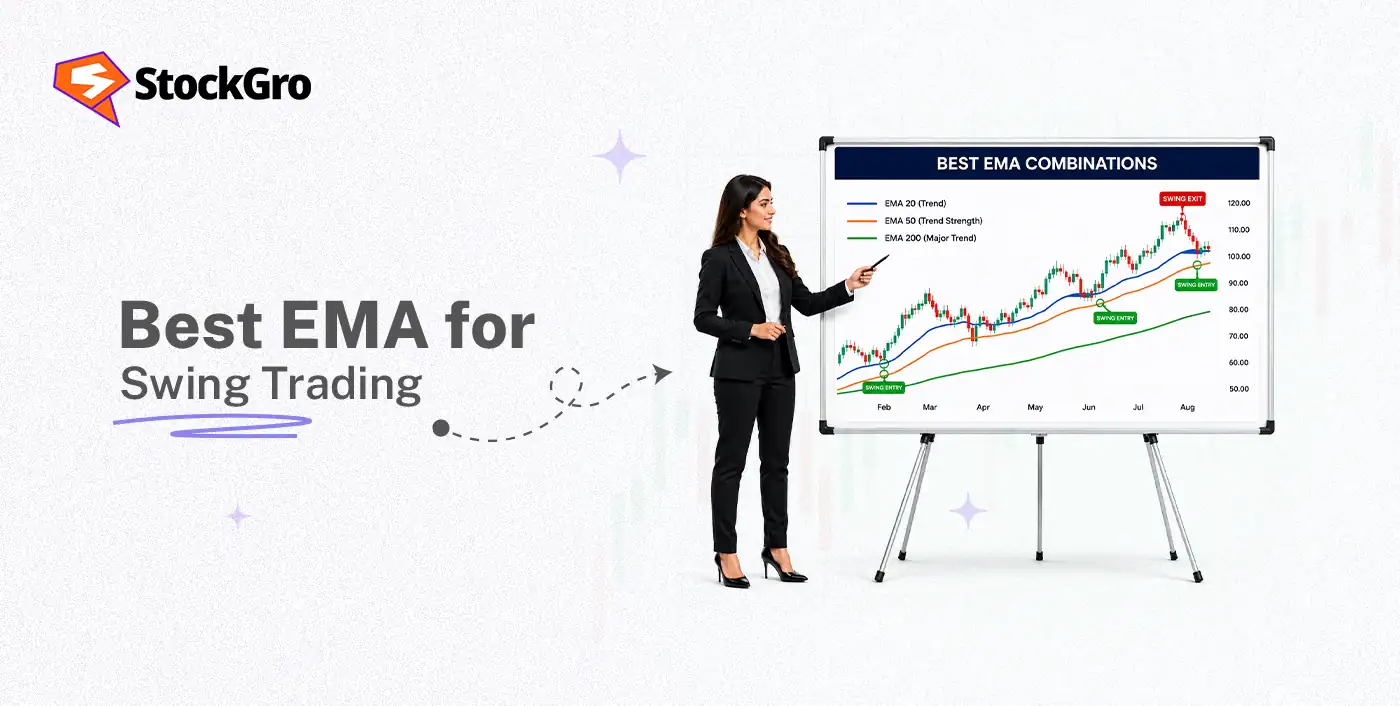
This is where most swing traders do their actual work. The 20 EMA is responsive but not erratic. It smooths out enough to be usable while still staying close to the current price. When a stock pulls back in an uptrend and finds support near the 20 EMA before pushing higher, that level is treated as a point for structured entry.
The 20 EMA line is closely watched by both retail and institutional traders alike.
50 EMA
The 50 EMA captures the bigger picture. It moves slowly enough to stay reliable across varied market conditions and tells you where the broader trend is headed.
Price above the 50 EMA, lean long. Price below it, stay cautious. That simplicity is precisely why the 50 EMA strategy works well.
How Traders Use EMA in Swing Trading
Knowing the settings is one thing. Applying them as part of a real swing trading strategy is another.
- Pullback Entry: A stock trends up, retraces to the 20 or 50 EMA, holds that level, and then resumes. That sequence is what many swing traders wait for before entering.
- Trend Bias Filter: Before placing any trade, check which side of the 50 EMA the price is on. This step eliminates a lot of trades that may look attractive on the surface but are actually moving against the broader trend.
- Stacked EMA Confirmation: The trend is considered strong when the different EMAs are all aligned in the correct order. Some traders will not enter unless this condition is met.
- EMA as an Exit Cue: A close below the 20 EMA on the daily chart often signals that the momentum behind a swing trade is fading. Many traders use this as a prompt to exit rather than wait for a larger reversal.
EMA Crossover Strategy
The EMA crossover strategy is based on how the EMAs interact with each other. You place two EMAs on the same chart and track when the faster one crosses the slower one. A crossover upward suggests buying momentum is building. A crossover downward hints at weakness or a potential reversal.
The 9 EMA crossing the 20 EMA on a daily chart is one of the more popular setups. The signal is clear, the logic is straightforward, and it removes a lot of the subjectivity that comes with reading price action alone.
Example: Assume a stock on the NSE is trading at ₹480. The 9 EMA sits at ₹472 and the 20 EMA at ₹468, meaning the stock has been consolidating. Over the next three sessions, buying picks up, and the stock closes at ₹495. The 9 EMA rises to ₹479, crossing above the 20 EMA, which now stands at ₹471.
A swing trader watching the daily chart spots the crossover and enters at ₹496. Stop placed at ₹469, just under the 20 EMA. Target set at ₹522. The stock reached ₹519 over the following week. Position was closed for a net gain of ₹23 per share.

Best Timeframe for EMA Swing Trading
Swing trading time frames influence everything, from the signal frequency and noise levels to how much time you need to spend monitoring.
Daily Charts
The daily chart is the default starting point for most swing traders. Each candle is one full session, and EMA-based setups on this timeframe tend to play out over days or weeks with manageable false signal rates. If you can check charts once a day, the daily chart is your natural home.
4-Hour Charts
The 4-hour chart serves traders who want more setups and are willing to monitor positions more actively. It reacts faster and creates more opportunities, but with that comes slightly more noise. Best suited for traders who can check markets a few times during the day.
Weekly Charts
They are for those operating in positions that can last weeks or even months. In this timeframe, the 20 and 50 EMAs carry real weight as long-term dynamic support levels. A bounce off the weekly 50 EMA in an established uptrend is not something most serious traders ignore.
Common Mistakes Traders Make
The EMA is a forgiving tool. Most of the damage comes from how traders use it, not from the tool itself.
- Overcrowding the Chart: Multiple EMAs plotted simultaneously do not give you more information. They give you more hesitation and contradictory signals.
- Ignoring the 50 EMA: Taking a long trade because the 9 crossed the 20, while the price is sitting well below the 50 EMA, is one of the more common trading mistakes that newer traders make.
- Expecting It to Always Hold: The 20 or 50 EMA will break on occasion, sometimes sharply. When a stock slices through a key EMA with strong volume, that is information too.
- Constant Settings Adjustment: Switching between different EMAs every few weeks prevents any real pattern recognition from forming. Consistency in settings builds an actual edge over time.
- No Stop, No Plan: Even the cleanest EMA setup requires a defined exit if the trade goes wrong. Skipping this step is where most accounts take their worst damage.
EMA vs SMA in Swing Trading
SMA and the EMA are built on the same foundation but behave quite differently. The following table compares EMA vs SMA:
| Parameter | EMA | SMA |
| Calculation | Weighted toward recent prices | Equal weight across all periods |
| Responsiveness | Reacts quickly to price changes | Lags noticeably behind price |
| False Signals | More common in choppy markets | Fewer, but misses early moves |
| Best Used For | Trending markets, active entries | Broader trend confirmation |
| Common Periods | 9, 20, 50 | 50, 100, 200 |
- Calculation: The EMA applies a multiplier that gives more weight to the latest prices. The SMA splits equal weight across every data point in the lookback period.
- Responsiveness: The EMA shifts direction sooner as it assigns higher weights to recent price data. SMA moves slowly and is often seen struggling to keep up with the price.
- False Signals: When markets are directionless, the EMA’s speed works against it and produces false signals. The probability of these false signals is lower in SMA.
- Best Use Case: Most traders use the EMA for entries and short-term management. The SMA tends to appear as a secondary confirmation layer.
- Common Periods: EMA time periods are usually shorter, like 9, 20 or 50 to capture recent price movement. SMAs use longer periods such as 50, 100 or 200.
Final Takeaway for Traders
The exponential moving average meaning is simpler than most traders expect. It reads recent price behaviour with less noise and gives your decisions a structured reference point. What makes traders successful with this tool is not a better setting or a cleverer combination. It is the discipline of reading the same setup the same way every time, letting high-probability conditions come to them, and respecting the stop when the EMA breaks.
FAQs
There is no particular best EMA for swing trading. Traders often use a 50 EMA to gauge trend direction and pair it with the 20 EMA for precise entries.
Yes, the 9 EMA works well for tracking short-term momentum. However, traders often combine it with slower EMAs like the 20 EMA to reduce false signals.
EMA does not predict reversals directly, but crossovers, price rejection near EMAs, and strong breaks below them can indicate weakening momentum or a possible trend change.
Daily charts are the preferred timeframe for most swing traders because they balance signal quality, manageable noise, and holding periods that typically last several days or weeks.
One is not universally better than the other. EMA reacts faster to recent price movement, making it useful for active swing trading setups. SMA is slower but often provides cleaner confirmation in less volatile markets.