When the chart seems stuck, neither rising nor falling with force, you might spot a bullish spinning top. With its small body and long wicks, it captures hesitation, yet leans gently toward the bulls. It’s not a bold signal, but sometimes, the quietest candles say the most. Let’s find out more about this pattern, what it really means and how it fits into market context.
What is a Bullish Spinning Top?
A bullish spinning top is a candle stick pattern where the open and close prices nearly the same, but there’s a wide price range between the high and low. It shows a compact real body, an extended upper tail, and a shorter lower wick. This shows both buyers and sellers were active, but buyers managed to close slightly higher than the open. It resembles a Doji but with a small bullish body.
How is the Bullish Spinning Top Candlestick Pattern Formed?
This pattern forms when there is high price movement but little net change by the close. The key signs are as follows:
- The candle features a compact real body close to the session’s low, with an elongated top shadow.
- Prices move up and down during the session, reflecting buying and selling.
- The close is just above the open, giving it a mild bullish nature.
- It often appears after a falling market, showing both sides were active before buyers took control.
Psychology Behind the Bullish Spinning Top
The bullish spinning top signals a session where both sides buyers and sellers were actively moving the price in both ways. The small body shows that neither side could fully dominate. However, the closing price being slightly above the opening suggests buyers had a slight edge by the end. This minor shift in control may suggest that downward pressure is easing and buying interest is emerging, possibly preparing for a price move in their favour.
When and Where Does the Bullish Spinning Top Appear?
The bullish spinning top tends to show up in areas where the market is either pausing after a decline or hovering near core price levels. It often appears near support zones, previous lows, or during sideways phases where larger participants are assessing their next move. While the candle itself isn’t loud, its timing within a broader structure can be telling. Its relevance also grows when it forms around reversal zones on higher timeframes like daily or weekly charts.
How to Identify a Bullish Spinning Top on a Chart
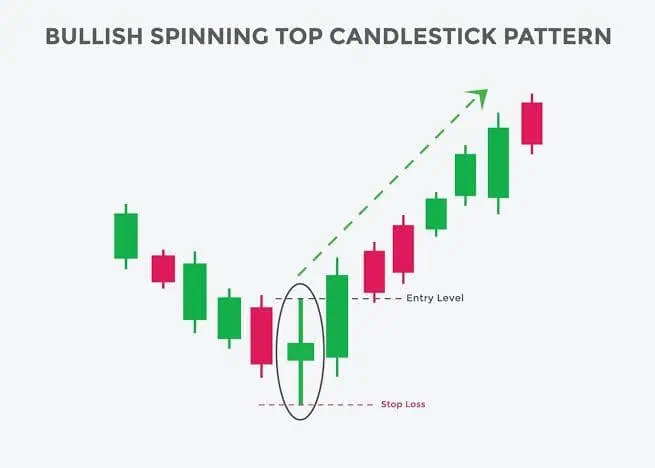
Here’s how you can visually recognize a bullish spinning top on a chart:
- Watch for a candle showing a small real body alongside an extended upper wick.
- Ensure the close is slightly higher than the open.
- Verify the presence of a short or nearly invisible lower shadow.
- This pattern often follows a series of downward candles.
- Bullish spinning tops during a falling market phase carry more meaning.
- Do not confuse it with a bearish spinning top, where the close is slightly lower.
- Seek assistance of charting tools and candle comparison help in proper identification.
What Does the Bullish Spinning Top Indicate?
This pattern suggests price activity was active but inconclusive during the session, with buyers slightly gaining strength by close. It often appears after a downward phase and may signal the beginning of buyer control. The small body shows price closing near the open, while the long upper wick indicates buying activity during the session. It can reflect a market where sellers are losing grip and buyers are gradually taking over, but the signal is subtle and best viewed with other indicators.
Bullish Spinning Top Trading Strategy: How to Use It in Real Trades
There are few simple steps to follow when using this pattern for technical analysis in trading, which include:
- Scan charts to find this pattern, especially after a falling market.
- Use it as a sign that buyers may soon take over, but only with other confirmations.
- Plan entering a position close to where the spinning top is spotted.
- Use a stop loss slightly below the spinning top to reduce risk.
- Track the trade and exit at a point where gains seem stable, using chart tools for help.
- Combine it with fundamental analysis to choose the right stock, not just any chart showing the pattern.
Is the Spinning Top Pattern Always Bullish?
Not always. A spinning top may signal bullishness or bearishness based on its chart location. It can form at the top or bottom of price movements. When it appears at the top of a rise, it may point to a possible reversal downward. At the bottom, it can suggest a possible recovery. However, by itself, it shows that the market lacked clear direction during the session
Example of Bullish Spinning Top in Action
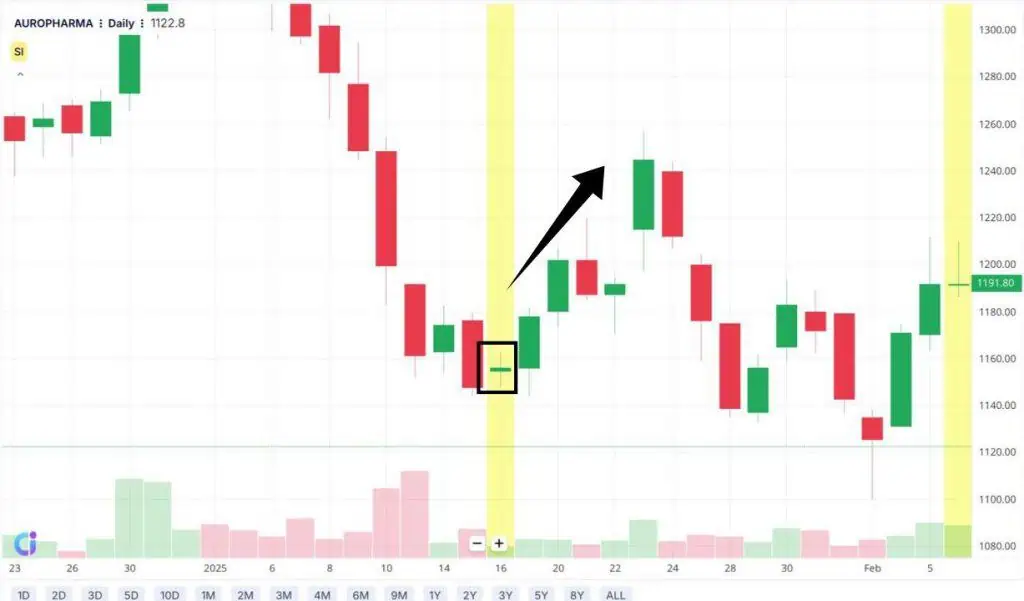
In this chart of Aurobindo Pharma Limited, a clear bullish spinning top appears on January 16, 2025. The candle formed after a sharp decline, reflecting a pause in selling activity. Its formation pointed to weakening seller strength. The strong upward movement in the sessions that followed confirmed it as an early signal of buying interest returning.
Best Indicators to Confirm a Bullish Spinning Top
There are some indicators that can help strengthen the interpretation of a bullish spinning top when used together. Some of which include:
- Volume: Measures the number of shares or contracts traded in a session.A bullish spinning top with rising volume suggests stronger interest from buyers as the session ends.
- Relative Strength Index (RSI): A strength-based tool that evaluates recent price increases and declines to judge if an asset is overbought or oversold. If RSI is below 30 when the spinning top appears, it adds weight to a possible price recovery.
- Moving Averages (MA): Shows the average price over a selected time period.A spinning top near or just above a long-term moving average can hint that the price is holding support.
- MACD (Moving Average Convergence Divergence): Tracks the relationship between two moving averages. If the MACD line is turning upward or crosses the signal line after a spinning top, it supports the idea of strengthening buying interest.
- Support Zones: Price levels where buying has historically occurred. A spinning top forming near a support level adds context, as it shows price reacting to a known buying area.
Best Timeframe for Spinning Top Pattern
The spinning top pattern is most commonly used on daily charts, as they give a clearer view of overall price behavior without the noise seen in shorter timeframes. Daily candles offer a more stable context to observe market balance. Long-term traders may also look at weekly charts for broader signals. The pattern can still appear on hourly or four-hour charts and may be used by those focusing on shorter moves. The selection of timeframe generally relates to the trader’s broader strategy.
Advantages of the Bullish Spinning Top
The benefits of this pattern are outlined below:
- Signals possible buyer return: When this pattern forms after a fall in prices, it may suggest that selling pressure is slowing down and buyers are starting to step in. This gives early insight into a possible upward move.
- Visually easy to identify: Its small real body combined with longer shadows makes it stand out on a chart, making it easy to spot even without complex tools or advanced chart setups.
- Works well with confirmation tools: The pattern becomes more reliable when used with technical indicators like RSI, MACD, or support-resistance levels, which help provide clearer context.
- Can help with entry timing: It often marks a pause in price movement, giving traders a point to watch for potential reversals or stabilization before entering a position.
- Highlights buyer-seller activity: The long shadows and narrow body reflect a tug-of-war between buyers and sellers, offering insight into market behavior within a single session.
Limitations of the Bullish Spinning Top
Despite its usefulness, this pattern has several limitations:
- Lacks strong confirmation alone: The pattern does not provide clear direction by itself and often needs additional confirmation from volume, price movement, or other patterns to be actionable.
- Frequent and sometimes misleading: It can appear often on charts, even in sideways or volatile markets, which increases the chance of misinterpretation and false signals.
- Can be misidentified easily: It closely resembles other candlestick patterns like Doji or bearish spinning tops, making it easy to mistake one for another without attention to details like the direction of the close.
- May fail in volatile markets: During news events or sharp market swings, the pattern may lose meaning as price movement can quickly invalidate the setup.
- Weak or no price after pattern: In many cases, prices may not rise significantly after the pattern appears, limiting its effectiveness for identifying actionable trade opportunities.
Bullish vs Bearish Spinning Top
The key difference lies bullish spinning top and bearish spinning top in the candle’s closing position relative to the open. Here’s how they differ:
| Feature | Bullish spinning top | Bearish spinning top |
| Appears after | Falling prices | Rising prices |
| Candle close | Slightly above open | Slightly below open |
| Market signal | Possible price rise | Possible price fall |
| Buyer-seller activity | Buyers gaining control | Sellers gaining control |
Spinning Top vs Doji vs Hammer
Each of these candlestick types reflects different forms of price behaviour during a session. The core differences among them are:
| Pattern | Body size | Shadows | Meaning |
| Spinning Top | Small | Long on both sides | Buyer seller activity stays balanced |
| Doji | Almost none | Varies | Complete balance; no direction gained |
| Hammer | Small (top) | Long lower, no upper | Buyers pushed price up after a drop |
Related Candlestick Patterns of Bullish Spinning Top
The patterns that relate closely to a bullish spinning top have been discussed below:
- Doji: Shows extreme price movement but closes at the same level it opened. A sign of equal strength between buyers and sellers.
- Hammer: Appears after a fall. Made up of a small body near the top and an extended lower tail, showing buyers took control after early selling.
- Morning Star: A three-candle pattern showing recovery from a decline. Consists of a long bearish candle, followed by a small indecisive candle (can be a spinning top), and then a strong bullish candle.
- Hanging Man: Resembles a hammer but develops following a price increase. A small real body near the top with a significantly long bottom wick. It may suggest selling pressure building up even in an up move.
Bullish Spinning Top And Bearish Spinning Top
A spinning top candlestick is a candle with a small real body and long upper and lower shadows. It represents indecision in the market — meaning buyers and sellers both tried to gain control, but neither dominated.
Bullish Spinning Top
A bullish spinning top appears after a downtrend. It shows that selling pressure is weakening and buyers are beginning to step in. Although it does not guarantee a reversal, it can signal a potential shift in momentum if followed by a strong bullish candle.
Key characteristics:
- Small body near the centre
- Long upper and lower wicks
- Appears after a decline
- Needs confirmation from the next candle
Bearish Spinning Top
A bearish spinning top appears after an uptrend. It indicates that buying momentum is slowing and sellers are entering the market. If followed by a bearish candle, it may signal a potential reversal.
Key characteristics:
- Small real body
- Long shadows on both sides
- Appears near resistance or after a strong rally
- Confirmation is essential
In both cases, spinning tops reflect indecision, not direction. The trend and confirmation candle determine whether it becomes bullish or bearish.
Conclusion
A bullish spinning top may not look powerful at first glance, but its message lies in subtlety. It captures a session of back-and-forth action that closes with buyers slightly ahead. On its own, it’s quiet. But alongside other signals, it can help build a clearer view of where price strength is quietly returning.
FAQs
A spinning top candlestick can be either bullish or bearish depending on the situation. It reflects market indecision with a small body and long wicks, showing a balance between buyers and sellers. It might indicate a pause, reversal, or continuation of the trend.
In intraday trading, the spinning top signals indecision. Traders usually wait for the next candle to confirm direction, break above high or below low of the spinning top, combined with other tools like support, resistance, or indicators to decide on entries and exits.
A bullish spinning top suggests a possible reversal after falling prices, but it is moderately reliable. Studies show about fifty six percent accuracy, improving when combined with other technical confirmations like momentum indicators or follow-up price action.
No, the spinning top and doji differ. A doji has almost identical open and close prices with little to no body, showing strong indecision. The spinning top has a small body with long wicks, indicating some price movement before closing near open.
A spinning top gains meaning when the following candle moves above its high for a bullish signal or below its low for a bearish signal. Additional support from increased trading volume or indicators like RSI or MACD helps strengthen the reliability of the pattern’s message.
Spinning tops appear on all timeframes, but daily or weekly charts provide clearer and more reliable signals due to less noise. Shorter timeframes can be used intraday but may have less dependable signals due to more random price moves.
A spinning top is neither purely bullish nor bearish. It represents indecision. Its meaning depends on where it appears in the trend and what candle follows it.
A bullish indecision candle is a pattern like a spinning top or doji that appears after a downtrend, suggesting sellers are losing strength and buyers may take control soon.
A spinning top has a small but visible body, meaning the open and close are slightly different. A doji has almost no body because the open and close prices are nearly equal. Both indicate indecision, but a doji shows stronger uncertainty.