
Every intraday trader wants the same thing. To know where price is likely to turn before it actually does. Camarilla pivot points make that possible. Calculated from the previous session’s high, low, and close, they map out the day’s key support and resistance levels before the market even opens, giving you an edge over traders who react instead of prepare. This blog covers the formula, key levels, strategies, and confirmation filters to trade them effectively.
Camarilla Pivot Points: Meaning, Formula & Key Levels Explained
Pivot points have long been a cornerstone of technical analysis, and camarilla pivot points take that foundation further. The Camarilla technique, introduced by Nick Scott in 1989, is built around a Fibonacci-based multiplier system. By applying the 1.1 factor to previous session data, the method generates compact price zones for entries, exits, and stop-loss placement.
In comparison to standard pivot points that anchor around a central pivot, camarilla pivots centre on the previous session’s close, making them far more responsive to recent price behaviour. The core premise is simple: unless a confirmed breakout occurs, price tends to revert toward its mean during the trading session.
What are Camarilla Pivot Points Pivot Point Formula
To calculate camarilla pivot points, you need three values from the previous trading session: High (H), Low (L), and Close (C). The range (H − L) is then multiplied by the Fibonacci-derived constant of 1.1 and divided by specific denominators to produce eight distinct levels.
Resistance levels:
• R1 = C + (H − L) × 1.1 / 12
• R2 = C + (H − L) × 1.1 / 6
• R3 = C + (H − L) × 1.1 / 4
• R4 = C + (H − L) × 1.1 / 2
Support levels:
• S1 = C − (H − L) × 1.1 / 12
• S2 = C − (H − L) × 1.1 / 6
• S3 = C − (H − L) × 1.1 / 4
• S4 = C − (H − L) × 1.1 / 2
Extended breakout levels:
• R5 = R4 + 1.168 × (R4 − R3)
• S5 = S4 − 1.168 × (S3 − S4)
What differentiates Camarilla pivot calculations is the inclusion of the 1.1 factor in the formula. The levels are computed each day using the prior session’s prices and stay unchanged during market hours. The tighter spacing between levels, a direct result of this multiplier, makes camarilla pivots more precise and better suited to fast intraday moves than standard pivot methods.
Key Levels Explained
Each of the eight levels carries a specific meaning and role in your trading decisions:
- R1 and S1 sit closest to the previous close and mark the first minor zones of intraday resistance and support. Price frequently oscillates between these levels on quieter sessions.
- R2 and S2 act as momentum indicators. A move through R2 on rising volume signals bullish intraday momentum; a breach of S2 signals bearish pressure building.
- R3 and S3 are the most actively watched reversal zones. R3 signals an overbought condition where a pullback is likely; S3 signals an oversold condition where a bounce is expected.
- R4 and S4 are the critical breakout thresholds. Closing decisively above R4 suggests upward strength, whereas a close beneath S4 points toward downside pressure.
- R5 and S5 are extended profit targets activated only after a confirmed breach of R4 or S4, used by momentum traders during strongly trending sessions.
How Camarilla Pivot Points Work in Real Market Conditions
Support resistance trading price action becomes increasingly more precise when you have pre-calculated levels anchoring your decisions. Camarilla pivot points provide exactly that. Fixed zones derived from the previous session’s price action that tell you, before the market opens, where price is most likely to react, pause, or break.
Intraday traders in Indian markets frequently use Camarilla pivot points on NSE and BSE to identify important entry, exit, and stop-loss levels in Nifty 50, Bank Nifty, and stock futures.
To see this in practice, consider a Nifty 50 example. Suppose the previous session closed with a High of 24,500, a Low of 24,150, and a Close of 24,380, a range of 350 points. Applying the camarilla formula gives the following values:
- S3 = 24,283, S4 = 24,188
- R3 = 24,477, R4 = 24,572
Nifty opens the next session at 24,310 squarely within the S3 and R3 band, immediately signalling a likely range-bound day. Price drifts lower through the first 30 minutes and touches S3 at 24,283. Rather than entering immediately, a trader watching price action waits and a bullish hammer candle forms right at S3, confirming the support is holding. A long entry is taken at 24,295 with a stop-loss below S4 at 24,188, targeting R1 and R2 progressively. Price recovers through the session and stalls near R3 at 24,477, where a short entry is triggered with a stop above R4.
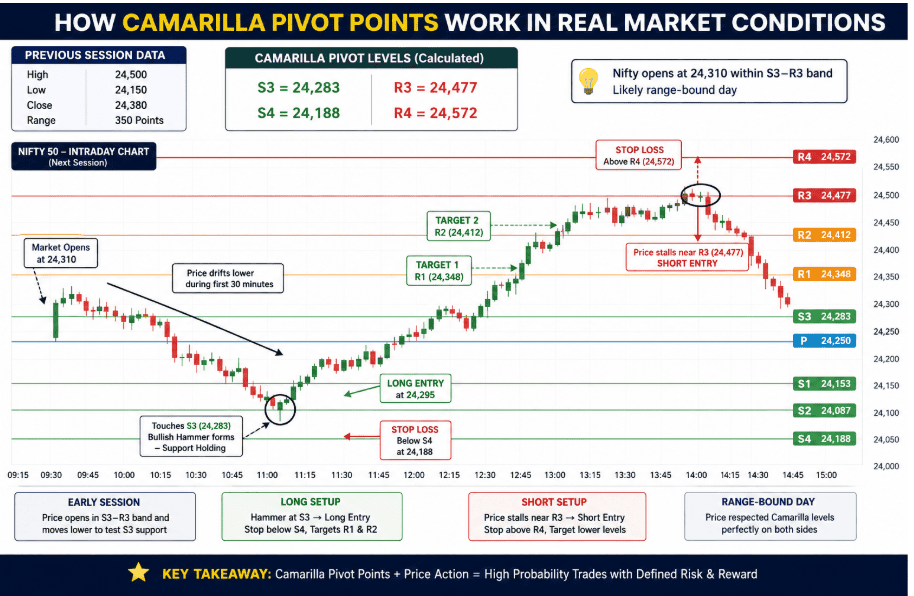
This is how camarilla pivot points function in real market conditions as a proper system where price action confirms what the levels suggest, and every trade has a clearly defined risk and reward before it is placed.
How to Use Camarilla Pivot Points for Intraday Trading (Step-by-Step)
Knowing how to use pivot points effectively comes down to reading the market correctly before placing a single trade. Camarilla pivot points support two primary approaches, a reversal trading strategy for range-bound sessions and a breakout trading strategy for trending ones. The opening price relative to S3 and R3 tells you immediately which mode to operate in, giving you a well laid out intraday trading plan from the moment the market opens.
Reversal Strategy: How to Trade Between Support and Resistance Levels
The reversal trading strategy works best when price opens within the S3–R3 band with no major catalyst driving a directional move. Support and resistance levels at S3 and R3 become your primary trade zones.
- Identify the day type: An open between S3 and R3 signals a range-bound session looking for reversal setups only.
- Wait for confirmation: Never enter on a level touch alone. Look for a hammer, pin bar, or engulfing candle at S3 for longs and at R3 for shorts.
- Manage risk clearly: Long trades commonly use stop-loss below S4 and aim for R1 or R2, whereas short trades place stops above R4 with S1 or S2 as targets.
Breakout Strategy: How to Trade Strong Moves Beyond R4 and S4
When a strong catalyst pushes price beyond R4 or S4, the breakout trading strategy takes over. This method focuses on trading in the direction of the prevailing price move rather than opposing it.
- Wait for a confirmed close: A candle close beyond R4 or S4 on a 5 or 15-minute chart confirms the breakout, a touch alone is not enough.
- Use R4 as new support: Once breached, R4 flips to support. Set your stop just below it and target R5 for profit-taking.
- Avoid gap opens: If price opens outside R4 or S4, wait for a pullback and consolidation before entering any trade.
Combining Camarilla Pivot Points with RSI, Moving Averages & Volume
Pairing camarilla levels with technical indicators filters out false signals and significantly improves trade quality.
- Relative strength index (RSI) is a momentum oscillator that measures whether a stock is overbought or oversold. An RSI trading below 30 at S3 confirms a long entry; above 70 at R3 confirms a short. RSI divergence at either level is an even stronger signal.
- A Moving average filters short-term price fluctuations to highlight the broader price direction. Use a 9-period EMA as a filter only takes longs at S3 when price is above it, and shorts at R3 when price is below it.
- Volume indicates the overall trading activity in terms of shares or contracts traded. A breakout beyond R4 or below S4 without strong volume participation often signals a possible reversal.
Benefits, Limitations & Common Mistakes to Avoid
Camarilla pivot points benefits for intraday traders are as follows;
- Opening bell analysis: The levels are fixed before the session begins, giving you a complete decision framework before the opening bell.
- Objective levels: Every trader using the same OHLC data arrives at the same numbers. No subjectivity, no repainting.
- Dual-use design: The same tool handles both range-bound and trending conditions through clearly defined rules for reversals and breakouts.
- Tight, actionable zones: The 1.1 Fibonacci multiplier produces levels closer to price than standard pivots, making them more precise for scalping and intraday swings.
- Flexible across markets: Camarilla pivots are useful for highly volatile stocks and great for index day trading , and work equally well in forex and futures.
Limitations
Camarilla pivot points have trading risks every investor should know before using:
- News events override levels: During high-impact announcements, price can gap through S4 or R4 instantly, making pre-calculated levels unreliable.
- Low liquidity weakens performance: The levels work best in liquid markets where price genuinely responds to structured zones. Thin stocks or low-volume sessions produce false signals.
- No directional bias built in: Camarilla levels show where price may react, they do not tell you which direction the day will ultimately move. Broader market context is always needed.
- Requires confirmation: If other indicators support the Camarilla pivot setup, the chances of reversal become higher. Used alone, the false signal rate rises considerably.
Common Mistakes to Avoid
These are the errors traders make most often with camarilla levels:
- Entering on a level touch alone: Always wait for a confirming candlestick before committing to any position at S3, R3, S4, or R4.
- Not analysing volume during breakouts: A breakout above R4 or below S4 on thin volume is far more likely to fail, always requiring a volume spike before treating it as confirmed.
- Overleveraging: Because camarilla setups can look highly convincing, traders often size up too aggressively. Keep risk to 1–2% per trade.
Camarilla vs Traditional Pivot Points: Which Is Better?
In pivot points vs camarilla comparison, the main difference is how the levels react to price movement during the trading session.
| Feature | Traditional pivot points | Camarilla pivot points |
| Developed for | General market analysis and broader support-resistance mapping | Intraday trading and short-term price reactions |
| Calculation based | Uses previous high, low, and close averages | Uses previous high, low, close with volatility multipliers |
| Number of levels | Pivot point + R1–R4 and S1–S4 | R1–R4 and S1–S4, sometimes R5/S5 |
| Distance between levels | Wider price gaps | Tighter and more compact levels |
| Sensitivity to price | Less sensitive | More sensitive to intraday volatility |
| Main trading use | Swing trading and directional trading | Scalping, intraday reversals, and breakout trading |
| Popular trading zones | Central pivot point, R1, S1 | R3/S3 reversal zones and R4/S4 breakout zones |
| Market type best suited | Trending and directional markets | Range-bound and fast intraday markets |
| Stop-loss placement | Wider stop-loss zones | Tighter stop-loss placement |
Conclusion
Camarilla pivot points work best when treated as a discipline, not just a tool. Consistency matters more than perfection; not every level will produce a clean setup, and not every session will trend. The traders who benefit most are those who combine these levels with patience, confirmation, and strict risk management, session after session.