Reading a price chart without indicators is like navigating without landmarks. You can see movement, but context is missing. Indicators do not forecast with certainty, yet they surface momentum shifts, exhaustion points, and structural clues that raw price data leaves buried. This blog walks through the most widely used trading indicators, along with their examples, and offers a practical framework for weaving them into your own approach.
Best Trading Indicators
- Moving Averages (MA)
- Relative Strength Index (RSI)
- Moving Average Convergence Divergence (MACD)
- Bollinger Bands
- Stochastic Oscillator
- Volume Indicator
- Fibonacci Retracement
- Average True Range (ATR)
- Ichimoku Cloud
- Parabolic SAR
There is no universal best here. Some indicators follow trends and catch reversals, while others measure volatility. Getting comfortable with what each tool does changes how usefully you apply it.
Moving Averages (MA)
A Moving Average calculates the average closing price over a chosen number of sessions and plots it as a continuous line. Newer data replaces older data as time passes, keeping the line current. The result strips away short-term noise and gives you a cleaner sense of direction.
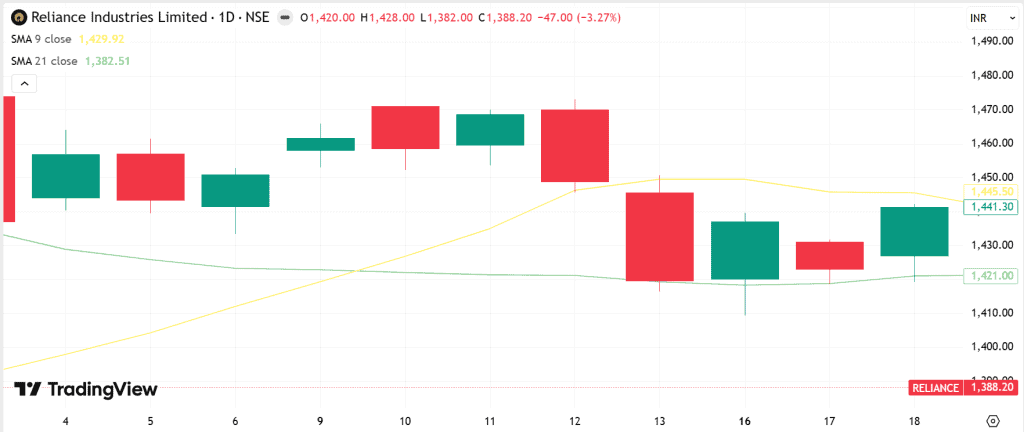
Two MAs are often used together. When the shorter-period average crosses above the longer one, it is called a golden cross and signals building bullish momentum.
Example: Reliance Industries formed a golden cross in February 2026 as its 9-day MA crossed above the 21-day MA at around ₹1,421, following a period of consolidation.
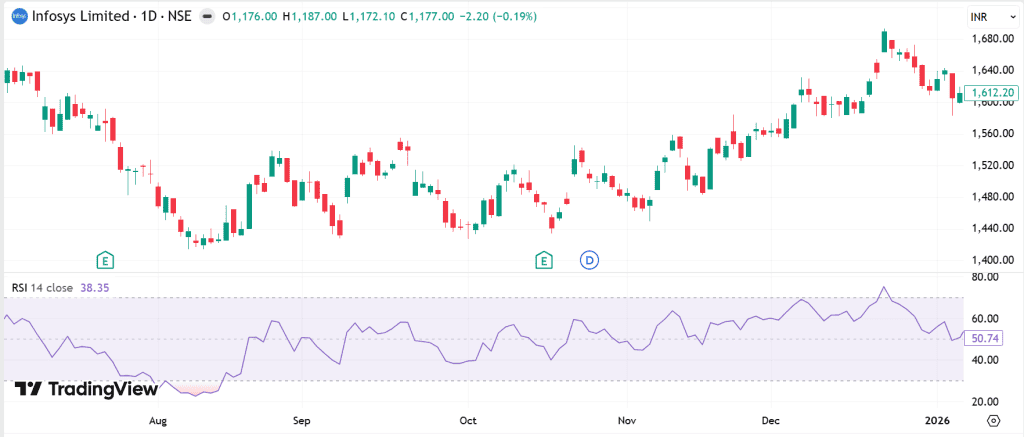
Relative Strength Index (RSI)
The RSI measures the speed and magnitude of price changes on a scale between 0 and 100. Above 70 suggests the asset may be overbought. Below 30 indicates potential oversold conditions.
Worth noting: RSI can stay elevated for weeks inside a strong trend. Selling purely on an above 70 reading has caught many traders off guard.
Example: In August 2025, Infosys price touched ₹1,420. RSI at that time was 22. The price remained range-bound for months before breaking above ₹1,650 in December 2025 with a 75 RSI score.
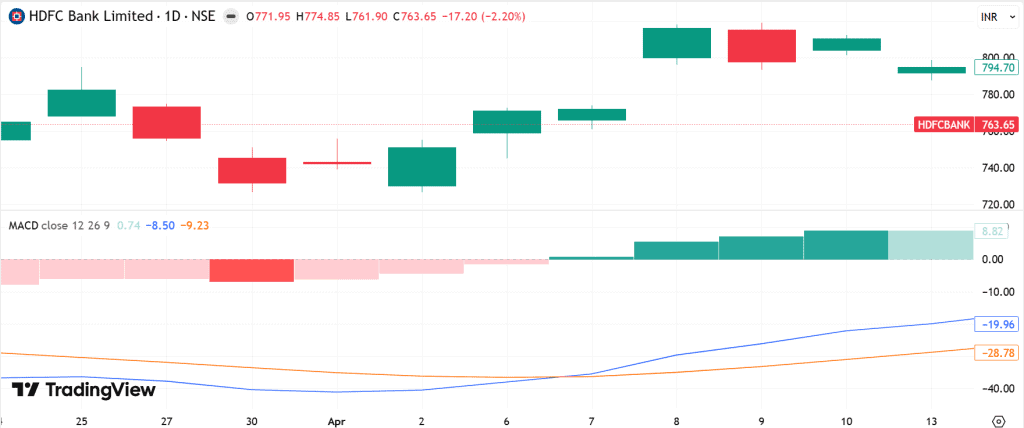
Moving Average Convergence Divergence (MACD)
The MACD is used to identify changes in a trend’s strength and direction. It takes the difference of a 26-period MA and a 12-period MA to produce the MACD line. A 9-period MA of that output becomes the signal line.
The MACD trading strategy focuses on the interaction of the MACD line and the signal line. When the MACD line crosses above the signal line points to upside momentum. When it falls below the signal line, the momentum is bearish.
Example: HDFC Bank’s stock formed a bullish MACD crossover in April 2026, with the histogram shifting from negative to positive territory. Price followed through over the next session. The alignment of both crossover and histogram made it a highly convincing read.
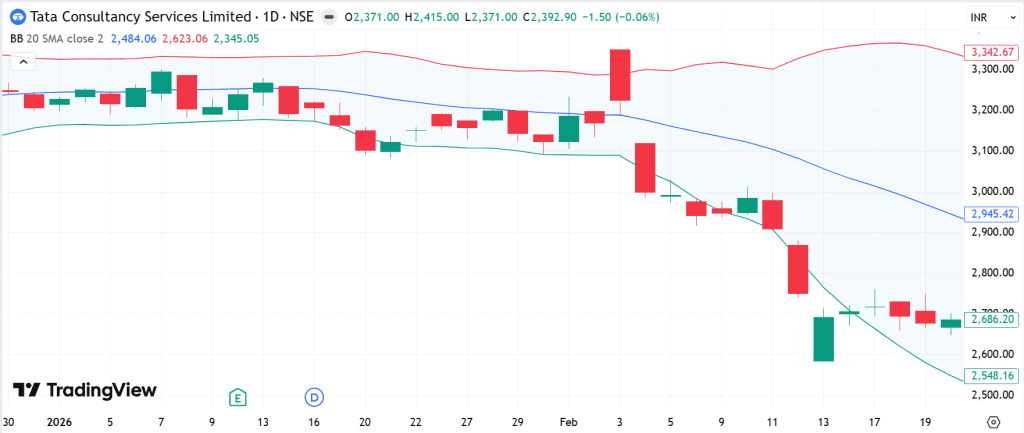
Bollinger Bands
John Bollinger created Bollinger bands in the 1980s. They measure the market volatility. They are made up of three lines. A 20-day MA sits in the middle. Two bands are placed above and below using the standard deviation. Wide bands mean the market is volatile. Narrow bands mean it is quiet, and quiet markets have a habit of not staying that way.
That narrowing is called a Bollinger Squeeze. Traders watch it specifically because sustained compression tends to precede a sharp directional move.
Example: Tata Consultancy Services (TCS) had a long Bollinger Squeeze in January 2026. Over roughly four weeks, the bands compressed unusually tightly before the price broke out decisively. Traders who had spotted this were better positioned to act when the breakout happened.
Stochastic Oscillator
The Stochastic oscillator compares the closing price to its price range over a specific period to reveal the momentum. Similar to RSI, it moves between 0 and 100, but also carries a signal line for confirming the crossover.
Above 80 = overbought, below 20 = oversold
The crossover of the two lines within those extreme zones gives traders a more specific timing cue.
Example: Asian Paints saw its stochastic drop below 20 in March 2026, followed shortly by an upward movement. The stock recovered gradually over the following fortnight and broke out above stochastic 80 on April 10, 2026

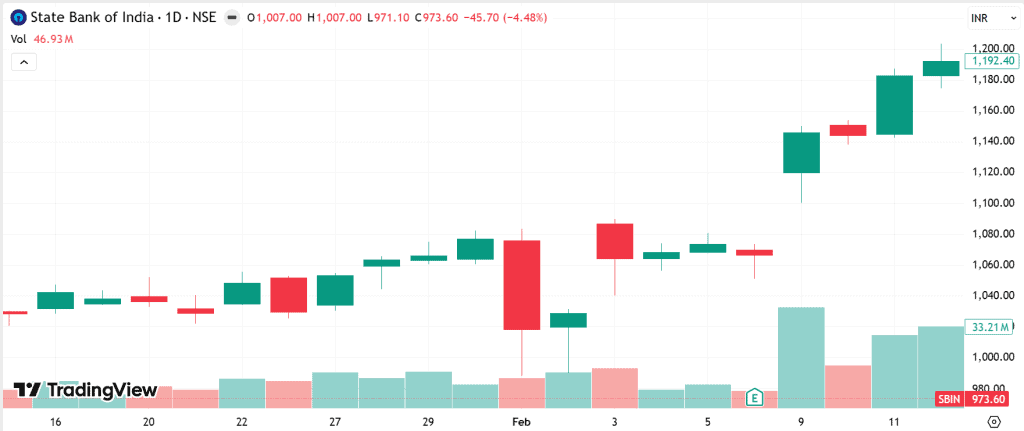
Volume Indicator
Volume tells you how many shares changed hands in a session. A price move on heavy volume carries real conviction. The same move on thin volume is worth questioning. If the price rises but volume keeps declining, that divergence is a signal of a slowdown or reversal.
Example: State Bank of India broke above its resistance zone on February 9, 2026, with a high volume reading. This expansion continued as the stock crossed ₹1,200 in the next few days.
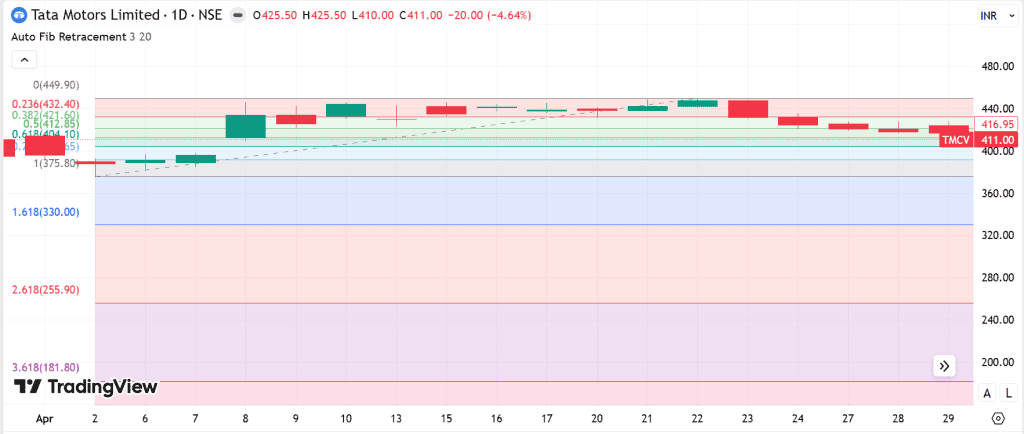
Fibonacci Retracement
Fibonacci Retracement identifies potential support and resistance levels during market pullbacks. The horizontal lines are placed at the 23.6%, 38.2%, 50%, and 61.8% levels, which act as zones where retracements commonly pause or reverse before the primary trend resumes.
Most traders closely watch the 61.8% level, as it signifies the key level where the trend may reverse or continue. It is also referred to as the golden ratio.
Example: Tata Motors shows a swing high of ₹449.90 and a swing low of ₹375.80 on its daily chart. The subsequent pullback found price consolidating just above the 61.8% retracement level at ₹404.10, holding that zone across multiple sessions. The 50% level at ₹412.85 has capped recovery attempts so far.
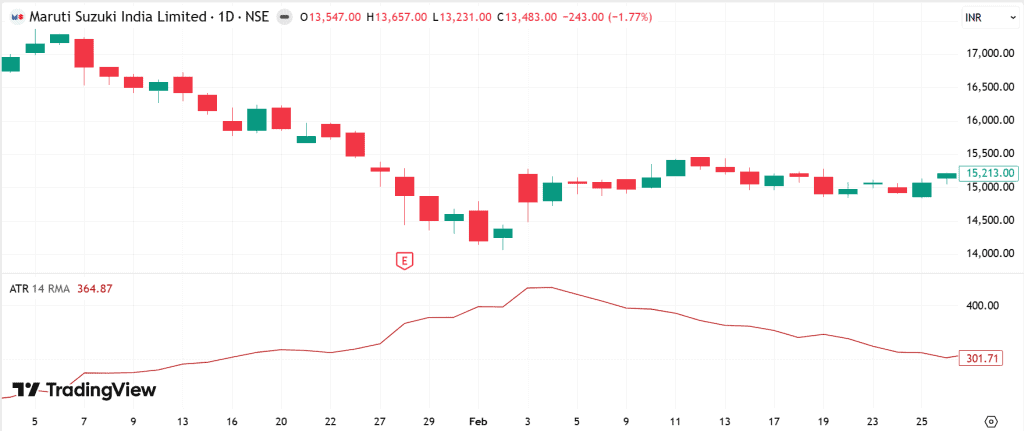
Average True Range (ATR)
ATR measures volatility rather than direction. A rising ATR means the market is expanding its range. A falling ATR signals consolidation.
Its primary use is in stop placement and position sizing. Ignoring ATR when setting stops is one reason many otherwise valid trades get closed out prematurely.
Example: Maruti Suzuki fell from ₹17,000 on January 5 to ₹14,400 by February 2, 2026. The 14-period ATR peaked at ₹433 on February 3, a big surge from ₹240 in early January. Traders using fixed stops below ₹250 were repeatedly closed out on normal daily swings throughout February.
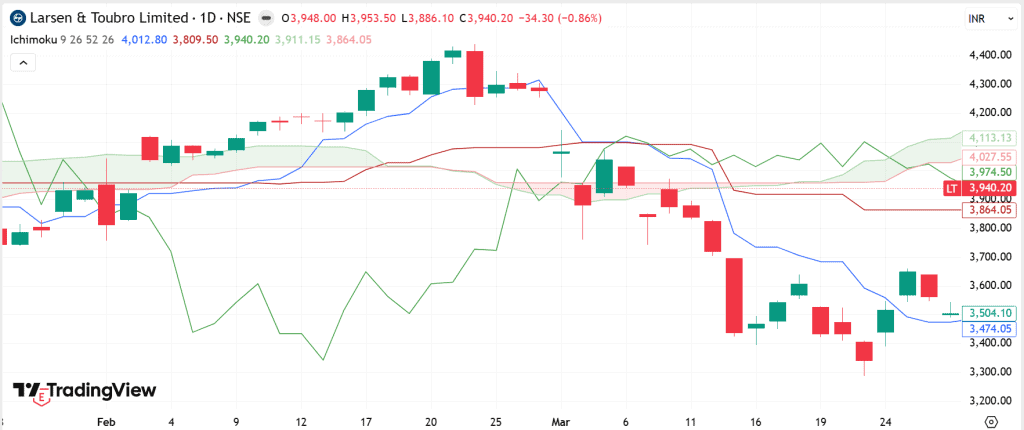
Ichimoku Cloud
Five lines. One indicator. The trend direction, momentum, support and resistance – Ichimoku Cloud provides you all. The shaded area between two of these lines forms the cloud, known as the Kumo.
Price above the cloud is a bullish environment. Below it is bearish. Price inside the cloud represents uncertainty.
Example: Larsen and Toubro stock was trading above the Ichimoku Cloud after mid February 2026. It rallied from ₹3,900 to hit its peak at ₹4,440 by February 24, 2026. Price then broke below the cloud when March started, and the stock declined to ₹3,288 by March 23. The cloud gave traders a clear structural signal on both sides: stay long above it, reassess the moment it broke below.
The cloud gave traders a clear structural signal on both sides: stay long above it, reassess the moment it broke below.
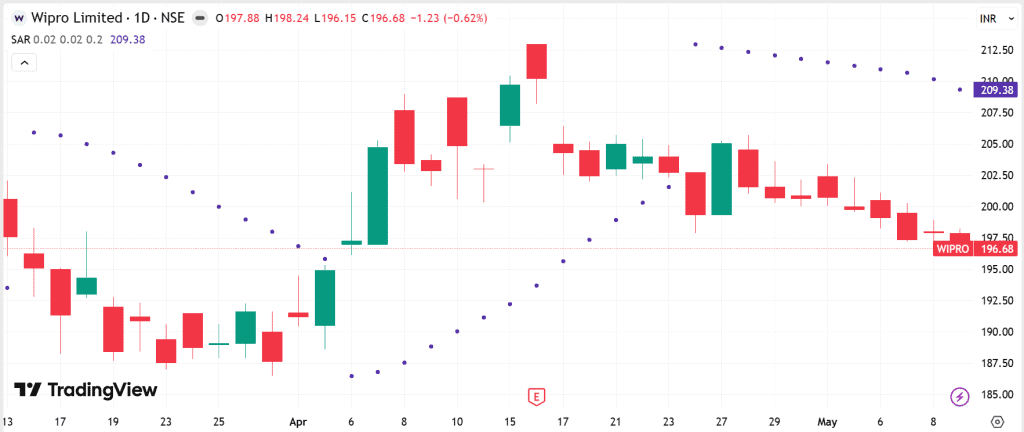
Parabolic SAR
Parabolic SAR places dots above or below price candles to indicate trend direction. Dots below the price mean the trend is up. When they flip to above price, a reversal may be forming. The dots also accelerate toward price the longer a trend runs, which makes the indicator progressively more sensitive as moves mature.
Example: Wipro saw its Parabolic SAR flip below price on April 6, triggering a bullish signal. The stock rallied to ₹210 by April 15. The SAR then flipped back above price on April 24, signalling renewed weakness.
How to Choose the Best Trading Indicators for Your Strategy
Piling indicators onto a chart is not analysis. The question worth asking is whether the tools you have chosen actually suit the way you stock market trade and the conditions currently in front of you.
Based on Trading Style
With so many indicators available, the key is choosing the right tool for your style.
- Fast momentum traders tend to rely on RSI and MACD because both respond quickly to price changes.
- Swing traders who hold positions over several days often find Moving Averages and Fibonacci Retracement more useful for identifying entry zones within a broader move.
- Intraday traders favour Parabolic SAR and the Stochastic Oscillator for their responsiveness on shorter timeframes.
Based on Market Conditions
The market environment determines which indicators will perform best:
- Trending markets: Moving Averages, Ichimoku Cloud, and Parabolic SAR all perform better when the price is moving with conviction.
- Sideways markets: Oscillators like RSI and Stochastic work well in these environments because price is cycling between levels rather than breaking into sustained directional movement.
Combining Indicators Effectively
Pairing one trend indicator with one momentum indicator is a sensible starting point. Adding ATR as a third layer helps with stop placement.
This is sometimes called confluence trading: waiting for independent signals from different indicator types to agree before taking action. Three indicators, each serving a distinct purpose, outperform six that partially overlap.
Common Mistakes to Avoid When Using Trading Indicators
One can fall into traps when dealing with the indicators. The common ones to look out for are:
- Treating signals as certainties: Every signal is a probability. Market movements are not rule-bound, and any price swing can cause the indicator to produce false signals.
- Overloading the chart: If two indicators tell the same thing, one of them is unnecessary. Redundancy creates false confidence rather than edge.
- Overlooking price action: All indicators derive from price. The raw chart structure, key levels, and candlestick behaviour should always frame how you interpret indicator readings.
- Never adjusting default settings: Standard settings were not calibrated for every stock or timeframe. Test different adjusted periods that will improve signal quality on the assets you actually trade.
- Entering without a stop: A well-read indicator signal loses all value without a defined exit plan. ATR-based stop placement connects your risk management directly to actual market volatility.
Conclusion
Indicators do not make trading decisions. They sharpen them. The traders who use these tools well are not the ones with the most lines on their charts but the ones who understand precisely what each tool measures and when it applies. Pick a small set, use them consistently, and let sound risk management carry the rest.
FAQs
No indicator stays accurate in every market condition. Traders usually combine different tools like RSI, MACD, or Moving Averages with price action for better confirmation.
Yes. Beginners often start with simple indicators like Moving Averages or RSI because they help identify trends, momentum, and possible entry or exit zones.
Using two or three indicators is usually enough. Too many overlapping signals can create confusion instead of improving trading decisions or providing clarity.
No. Indicators support decision making, but trading success also depends on risk management, discipline, market understanding, and consistent execution over time.