Currently holding the third position globally in terms of volume, the Indian Pharmaceutical industry has transformed into a robust sector, expanding at a Compound Annual Growth Rate (CAGR) of 9.43% for the last nine years. Projections indicate that by 2030, the value of the Indian pharmaceutical market could reach an impressive $130 billion.
Amidst this backdrop, one company that has consistently made its mark is Neuland Laboratories. This article explores the recent release of Quarter 4 results by the company and how it has impacted its share prices in the market.
Neuland Laboratories Ltd
Founded in 1984, Neuland Laboratories Limited is a publicly traded company based in Hyderabad, India. With a focus on being a 100% API provider, Neuland has established itself as a premier manufacturer of active pharmaceutical ingredients (APIs) and a comprehensive solutions provider for the chemical needs of the pharmaceutical industry.
The company’s expertise lies in the production of APIs and advanced intermediates from their facilities, which have received approval from the US FDA. Their primary strength is the application of robust process chemistry within a regulatory-compliant framework, backed by a highly skilled team of over 1600 employees.
For over 40 years, Neuland has been a leader in drug development and cGMP manufacturing of APIs. Their technical and scientific teams provide a wide range of solutions and services to the international pharmaceutical industry, ensuring quality, environmental health and safety (EHS), and compliance across all their facilities.
Neuland’s commitment to quality is demonstrated by its history of regulatory approvals, including 16 successful inspections by the US FDA. Neuland has a global footprint that extends to more than 80 countries, with exports making up over 78% of their revenue.
Neuland Laboratories Q4 result
These are the key financial metrics of the company as compared with the same quarter of the previous year:
| Q4 FY2024(₹ crores) | Q4 FY2023(₹ crores) | Change (%) | |
| Revenue | 385 | 407 | -5.41 |
| Operating profit | 107 | 120 | -10.83 |
| Profit before tax | 92 | 110 | -16.36 |
| Net profit | 68 | 85 | -20.00 |
| EPS | 52.66 | 65.89 | -20.08 |
Source: Screener
The table indicates a downward trend across all key performance indicators when comparing the fourth quarter of one fiscal year to the same quarter of the previous year. This suggests that the company experienced a challenging quarter with reduced profitability and earnings.
Let’s have a look at the snapshot of a few key operating metrics revealed in the Q4 results and their quarterly progression.
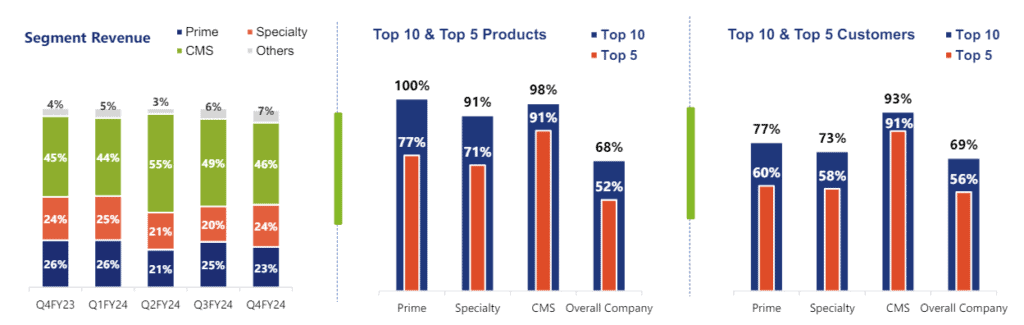
Source: Neuland Laboratories
Must read: Latest update: SBI Bank Q4 results analysis & highlights!
Annual performance of Neuland Laboratories Ltd
These are the key financial metrics of the company as compared with the previous year:
| FY2024(₹ crores) | FY2023(₹ crores) | Change (%) | |
| Revenue | 1,559 | 1,191 | 30.90 |
| Operating profit | 463 | 273 | 69.60 |
| Profit before tax | 401 | 216 | 85.65 |
| Net profit | 300 | 164 | 82.93 |
| EPS | 233.89 | 127.45 | 83.52 |
Source: Screener
The financial overview for the fiscal year indicates a positive trend, with the company experiencing significant growth across various financial metrics, compared to the previous fiscal year. This suggests a strong financial performance and an overall increase in profitability for the company.
Let’s have a look at the snapshot of a few key operating metrics revealed in the Q4 results and their annual progression.
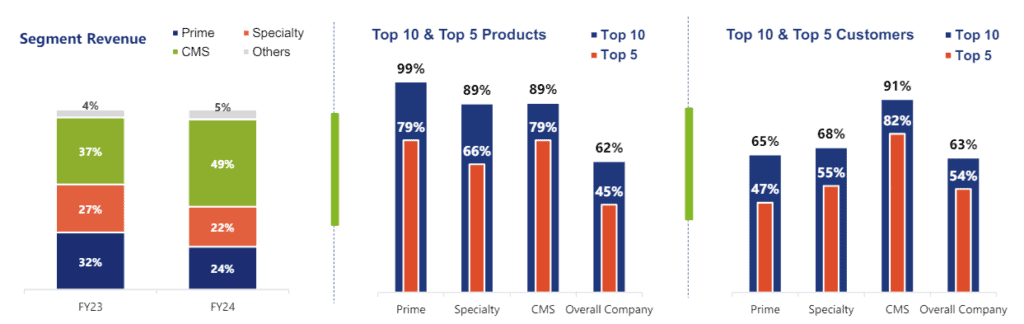
Source: Neuland Laboratories
Market reaction to Neuland Laboratories Ltd’s results
Neuland Laboratories’ latest news: The company’s board of directors has proposed a final dividend of ₹14 per share, which is 140% of the face value of ₹10 each, for the fiscal year 2023-24. This dividend will be distributed to shareholders five days or later after its approval at the 40th Annual General Meeting (AGM).
When talking about the company’s share price, Neuland Laboratories’ share price experienced a significant drop of up to 14.5% to ₹6096.75 per share on the BSE during Monday’s intraday trading (May 13, 2024). This sharp decline in stock prices was a reaction to the company’s underwhelming performance in the earnings report for the January-March quarter of the fiscal year 2023-24.
Neuland Laboratories Ltd’s share price, as of May 14, 2024, is ₹6,255.00. This chart depicts the trading pattern of the stock over five days, clearly showing a noticeable plunge.
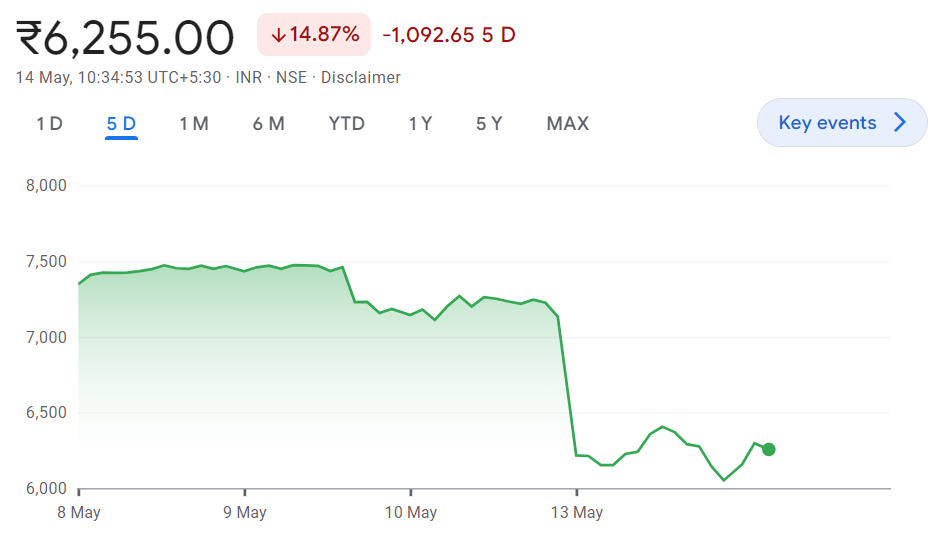
Source: Google Finance
Also read: Hero MotoCorp Q4 results: Market reaction insights
Peer comparison of Neuland Laboratories Ltd
Let’s examine how Neuland Laboratories is performing relative to its peers in the industry:
| Current Price (₹) | Market Cap (₹ crores) | P/E | ROE (%) | Earnings yield (%) | |
| Neuland Lab | 6,255 | 7,776 | 25.9 | 26.4 | 5.36 |
| Sun Pharma | 1,535 | 3,68,382 | 39.3 | 16.6 | 3.14 |
| Cipla | 1,381 | 1,11,501 | 26.2 | 17.0 | 5.26 |
Source: Screener (As of May 14, 2024)
In comparison to other companies in the pharmaceutical sector, Neuland Laboratories presents positive financial indicators, such as a comparatively lower price-to-earnings (P/E) ratio and a superior return on equity (ROE). This implies that the company maintains its competitiveness in the industry.
Future outlook of the industry
The global pharmaceuticals market is set for substantial growth, with projections indicating an increase from $1,444 billion in 2023 to $2,172 billion by 2030. This represents a Compound Annual Growth Rate (CAGR) of 6%. Factors such as the rising incidence of chronic and lifestyle diseases, along with a growing demand for more sophisticated and specialised medicines, are driving this growth.
Neuland Labs, with its dedication to innovation and quality, as demonstrated by its multiple regulatory filings and approvals, is well-positioned to capitalise on these market trends.
In addition, the global market for generic drugs is expected to experience strong growth, predicted to reach $760 billion by 2030, with a CAGR of 7.1%. Neuland’s strategic focus on the GDS segment, transitioning from the low-margin Prime to the high-margin Specialty and CMS segments, aligns with this trend.
The company’s commitment to regulated markets and quality-focused customers, along with its efforts to optimise its existing portfolio and expand its pipeline, points towards a promising future outlook.
Also read: The pharmaceutical industry in India and its contribution to the world
Bottomline
Neuland Laboratories Ltd. has demonstrated a mixed performance in its recent quarterly results, marked by a decline in key financial metrics compared to the same period in the previous fiscal year, resulting in a drop in share prices.
However, the annual performance showcases significant growth across various financial indicators, reflecting a strong financial performance and increased profitability for the company.
The global pharmaceuticals market is set for substantial growth, and Neuland Labs, with its dedication to innovation and quality, is well-positioned to capitalise on these market trends.