- Summary
- WeWork India has delivered a high revenue of ₹766.5 crore, up by 32.5% YoY, when compared to Awfis’s reported revenue of ₹439 crore, up by 20% YoY.
- Awfis reported EBITDA of ₹174 crore with a 39.6% margin, compared with WeWork India’s IGAAP-equivalent EBITDA stands at ₹162.9 crore and 21.2%.
- PAT rose 93% YoY to ₹31 crore for Awfis, while WeWork India reported ₹65.8 crore, up 67.4% YoY.
- WeWork India achieved 83.7% portfolio occupancy, ahead of Awfis at 76.2%, with mature centre occupancy at 87.7% versus 84.1%.
- Awfis has a total of 254 centres across 18 cities, while WeWork India manages 85 centres across eight cities.
Awfis vs WeWork India Q2 FY27 Results at a Glance
The following table provides an overview of the key Awfis vs WeWork India Q2 FY27 results:
| Particulars | Awfis (Reported Figures) | WeWork India(Adjusted Figures) |
| Revenue from Operations (₹ crore) | 439 | 766.5 |
| Revenue Growth (YoY) | 20 | 32.5 |
| EBITDA (₹ crore) | 174 | 162.9 |
| EBITDA Margin (%) | 39.6 | 21.2 |
| EBITDA Growth (YoY %) | 31 | 37.6 |
| Profit After Tax (PAT) (₹ crore) | 31 | 65.8 |
| PAT Growth (YoY %) | 93 | 67.4 |
| PAT Margin (%) | 7.0 | 8.6 |
| Portfolio Occupancy (%) | 76.2 | 83.7 |
| Mature Centre Occupancy (%) | 84.1 | 87.7 |
| Total committed area, including LOIs (million sq. ft.) | 9.4 | 13.0 |
| Number of Operational Centres | 244 | 85 |
| Cities of Operation | 18 | 8 |
Note: Awfis figures represent reported results, while WeWork India figures are IGAAP-equivalent adjusted numbers wherever applicable.
How Awfis and WeWork India Make Money
Awfis and WeWork India primarily generate revenue from leasing, building out and managing flexible office spaces, desks and enterprise suites. But they use different operational and financial models.
How Awfis Makes Money
- Co-working and managed offices: Awfis earns rental income by providing flexible desks, private cabins and managed office spaces to corporates, startups and MNCs. This segment generated ₹376 crore in Q2 FY27, growing 31% YoY and accounted for the bulk of its operating revenue. These segment figures are on a normalised basis and together account for ₹451 crore. Awfis’s reported revenue from operations was ₹439 crore.
- Office design and fit-out services: Through Awfis Transform, the company designs, constructs and fits out offices for third-party clients. It generated ₹75 crore in Q2 FY27, with third-party projects contributing 93% of its business.
- Allied workplace services: It provides additional services such as food and beverages, IT support and parking facilities. These services help generate additional income from existing workspace clients and improve revenue per seat.
- Asset-light expansion model: Awfis expands its operating space through management agreements and landlord partnerships and has 57% of its centres operating under management agreements in September 2026, where the landlords fund the fit-out costs.
How WeWork India Makes Money
- Private and managed offices: WeWork India earns its primary revenue by offering private offices, dedicated workspaces and managed office solutions to businesses. These core operations generated ₹657.7 crore in Q2 FY27, contributing 61.1% and 24.7% (total 85.8%) of its operating revenue.
- Value-added services: The company generates additional income through meeting and event spaces, food and beverages, office customisation and technology services. This segment contributed ₹79.6 crore in Q2 FY27, growing 35.2% YoY.
- Digital products: WeWork India offers virtual offices, All Access memberships and workplace management solutions. These products allow customers to access workspace services beyond conventional office memberships and generated ₹29.2 crore in Q2 FY27, up 45.6% YoY.
- Flexible workspace formats: The company offers day passes, private offices, managed offices and All Access memberships to serve different business requirements. Around 30% of customers in its physical workspaces use multiple formats, allowing WeWork India to cater to varied workspace needs and generate revenue through multiple offerings.
Q2 FY27 Revenue and Growth: Awfis vs WeWork India
Compared to Awfis, WeWork India Q2 FY27 results reflected a higher revenue with a 32.5% YoY growth.
| Revenue Metric | Awfis | WeWork India |
| Revenue from operations (in ₹ crore) | 439 | 766.5 |
| YoY Growth (%) | 20 | 32.5 |
| QoQ Growth (%) | – | 11.5 |
Operating Metrics: Seats, Centres, Occupancy and Pipeline
Both Awfis and WeWork India expanded their workspace capacity during Q2 FY27, adding seats and centres to meet growing demand.
| Operating Metric | Awfis | WeWork India |
| Operational Seats / Desks | 164K+ | 145.3K |
| YoY Growth in Seats / Desks | 11.5% | 26.9% |
| QoQ Growth in Seats / Desks | 3.1% | 8.8% |
| Operational Centres | 244 | 85 |
| Total Supply (Centres) | 254 | 85 |
| Total Supply (Seats / Desks) | 174K | 145.3K operational |
| Cities of Operation | 18 | 8 |
| Total committed area, including LOIs (million sq. ft.) | 9.4 | 13.0 |
| Portfolio Occupancy (%) | 76.2 | 83.7 |
| Mature Centre Occupancy (%) | 84.1 | 87.7 |
| Signed/Committed centres | 270 | – |
| Total signed/committed capacity | 188K | 190K-195K desks |
| Incremental committed capacity | – | 47K+ desks |
Awfis and WeWork India Profitability: Reported vs Real
Here is how the reported and adjusted profitability of Awfis and WeWork India compare across key financial metrics:
| Profitability | Awfis | WeWork India | ||
| Reported(IndAS) | Adjusted (Cash) | Reported(IndAS) | Adjusted(IGAAP Equivalent) | |
| EBITDA (₹ crore) | 174 | 49 | 508.7 | 162.9 |
| EBITDA Margin (%) | 39.6 | 10.8 | 64.7 | 21.2 |
| PAT (₹ crore) | 31 | – | 20.5 | 65.8 |
| PAT margin (%) | 7.0 | – | 2.6 | 8.6 |
Note: Awfis reports EBITDA and PAT under Ind AS, while its cash EBITDA is an alternative operating performance measure after specified cash adjustments.
Balance Sheet and Cash Flow: Awfis vs WeWork India
The table below provides insights into the key balance sheet and cash flow figures of both companies:
| Particulars | Awfis | WeWork India |
| Net debt / (Net cash) (in ₹ crore) | (73) | (23.1) |
| Gross borrowings (in ₹ crore) | – | 390.2 |
| Net debt-to-equity ratio (in times) | (0.12) | – |
| Gross debt-to-equity ratio (in times) | 0.11 | – |
| Return on capital employed (ROCE) (%) | – | 34.5 |
| Total assets (in ₹ crore) | 3,080* | 7,369.82 |
| Total equity (in ₹ crore) | 609* | 342.07 |
| Cash and cash equivalents (in ₹ crore) | 55* | 413.3 |
| Total lease liabilities (in ₹ crore) | 1,473* | 5,233.12 |
| Cash flow from operations (in ₹ crore) | 368* | 1,026.2 |
| Free cash flow from operations (FCFO) (in ₹ crore) | – | 237.7 |
| Free cash flow to firm (FCFF) (in ₹ crore) | – | 61.9 |
*Figures are as of September 2026 (H1 FY27)
Return Ratios: ROE and ROCE Compared
The ROE and ROCE of WeWork India and Awfis Q2 FY27 are given below.
| WeWork India | Awfis | |
| ROE | Not Disclosed | Not disclosed |
| ROCE (annualised) | 34.5 | Not disclosed |
| ROCE YOY improvement | 1,235 bps | Not disclosed |
WeWork India reported a ROCE of 34.5% in Q2 FY27, an increase of 12.35 percentage points year-on-year and 5.9 percentage points quarter-on-quarter. On the other hand, Awfis’ Q2 FY27 investor presentation does not disclose ROE or ROCE.
WeWork India has reported an improvement in its return on capital. However, a direct ROE and ROCE comparison between the two companies is not possible because Awfis has not disclosed these ratios in its Q2 FY27 presentation.
Awfis vs WeWork India Valuation: P/E, EV/EBITDA and Market Cap
The following table compares WeWork India and Awfis using the latest available market valuation data as of 4th November 2026:
| WeWork India | Awfis | |
| P/E (in times) | 87.41 | 20.36 |
| EV/EBITDA | _ | _ |
| Market Capitalisation (in cr) | 9,165.43 | 1,937.07 |
WeWork India has a higher market capitalization than Awfis, at approximately ₹9,165.43 crore compared with Awfis’ ₹1,937.07 crore. This means the market currently places a much higher value on WeWork India. However, market capitalisation alone does not show whether a stock is expensive or cheap. For this, investors also look at the P/E and EV/EBITDA ratios. P/E compares the share price with earnings per share, while EV/EBITDA compares the company’s total business value with its operating earnings. Neither company’s Q2 FY27 investor presentation directly reports these valuation multiples.
Shareholding and Promoter Risk
The September 2026 shareholding disclosures show differences in promoter ownership and pledged shares between WeWork India and Awfis.
- WeWork India: Promoters held 48.20% of the company’s shares as of 30 September 2026. Around 34.97% of their holdings were pledged. This equals approximately 16.86% of the company’s total share capital.
- Awfis: Promoters held 17.00% of the company’s shares. The company reported no pledged promoter shares during the same period.
This makes promoter pledging an important risk to watch in WeWork India. Although WeWork India has higher promoter ownership, a part of this holding is pledged. Awfis has lower promoter ownership but no reported promoter share pledging. Investors should track changes in promoter ownership and pledged shares in future quarterly disclosures.
What Management Said on the Q2 Earnings Calls
The Q2 FY27 management commentary highlights WeWork India’s expansion plans, improving profitability and cash position. Awfis, meanwhile, has highlighted demand from large companies and GCCs, premium workspaces and better operating efficiency.
WeWork India
- Expansion plans: The company added around 11,700 desks during Q2 FY27, taking its total capacity to around 1.45 lakh desks across 85 centres present in 8 cities. It expects to reach 1.5–1.55 lakh desks by March 2027.
- Strong enterprise demand: Enterprises contributed 77% of core revenue, while GCCs accounted for nearly 41% of its overall business mix.
- Improving profitability: Revenue increased 32.5% year-on-year to ₹766.5 crore, while EBITDA rose 37.6% to ₹162.9 crore. PAT increased 67.4% to ₹65.8 crore.
- Better cash position: The company moved from net debt of ₹310.5 crore a year ago to net cash of ₹23.1 crore at the end of September 2026.
- Future growth: Management indicated that it is considering additional capacity expansion for FY28 because of strong demand from customers.
Awfis
- Demand from large companies: The company continued to see demand from large corporates, MNCs and clients operating across multiple locations. Its co-working revenue grew 31% year-on-year to ₹376 crore.
- Premium workspaces: Awfis expanded its Gold and Elite portfolio to 39 centres. It also reported that new seats were being signed at around 35% higher prices than its flagship products.
- GCC business: The company served more than 105 GCC clients, which contributed around 24% of rental revenue. It also signed a mandate for over 1,000 employees with a Fortune 500 company in Chennai.
- Expansion: Awfis added 6 new centres during the period of Q2 FY27, taking its network to 254 centres with approximately 1.74 lakh seats present across 18 cities.
- Profitability target: Management aims to achieve cash EBITDA of ₹190–200 crore for FY27. It also plans to improve occupancy and expand through capital-efficient models, where landlords fund fit-out costs.
Market Reaction: Share Price, Broker Targets and Technicals
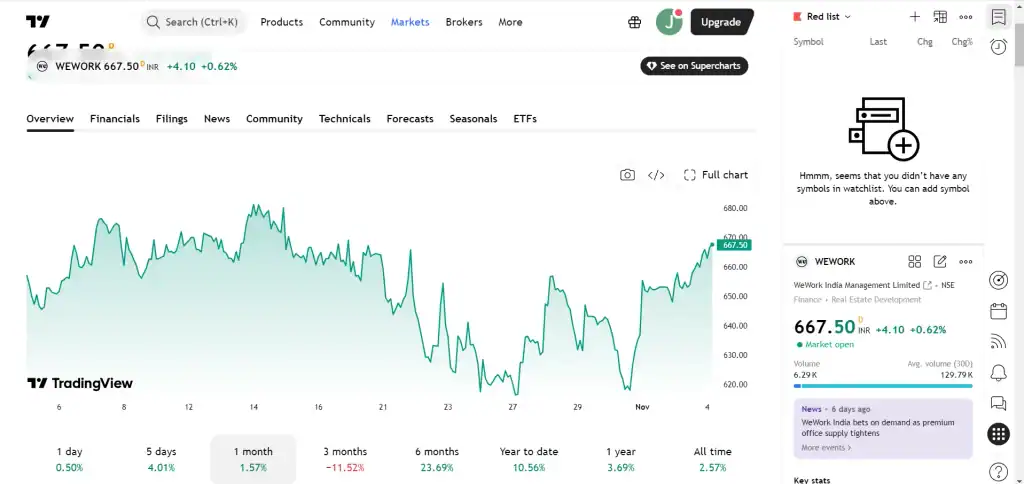
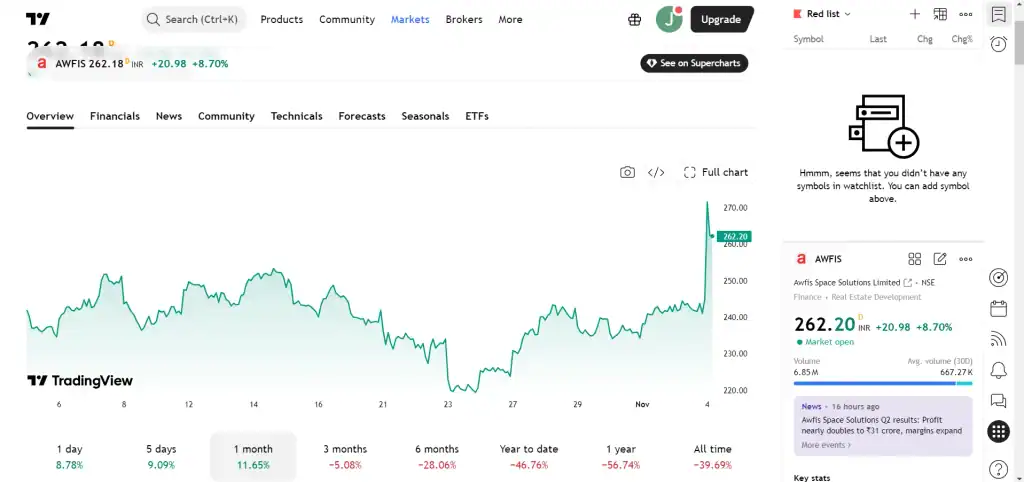
The share-price movement of WeWork India and Awfis shows different market trends. The comparison below uses market data available up to 3 November 2026.
1. Share price movement
| Particulars | WeWork India | Awfis |
| Share price before result | ₹623.40 (26 Oct 2026) | ₹232.74 (30 Oct 2026) |
| Closing price after result | ₹626.10 (27 Oct 2026) | ₹241.20 (2 Nov 2026) |
| Change | 0.43% | 3.64% |
WeWork India’s share price increased by 0.43% in the trading session after the company announced its Q2 FY27 results after market hours on 26 October 2026. Awfis Space Solution share price reaction to its Q2 FY27 results is not yet available. The company announced its results after market hours on 3 November 2026, and the next trading session is 4 November 2026.
2. Broker Targets
Neither WeWork India’s nor Awfis’ Q2 FY27 investor presentation provides an official broker price target.
- WeWork India: Management highlighted plans to increase its total capacity to 1.5–1.55 lakh desks by March 2027. It also reported a 31.6% year-on-year increase in Q2 revenue and a 37.6% increase in EBITDA. These figures show its business growth plans and performance, but they are not broker estimates of its share price.
- Awfis: The management focused on expanding its premium Gold and Elite centres, growing its GCC client base and improving cash EBITDA. It also reported six new centre additions during Q2 FY27. These updates reflect its expansion and profitability plans, not a forecast of its stock price.
3. Technicals
Key Risks of Investing in Awfis vs WeWork India Stock
WeWork India and Awfis face risks related to office leases, occupancy, client demand and expansion costs. Both companies lease office spaces, invest in setting them up and earn revenue by renting them to businesses.
| Risk Basis | WeWork India | Awfis |
| Lease commitments | The company must continue paying rent even if some office desks remain vacant or clients leave | Vacant seats can affect its ability to recover rental and operating costs |
| Occupancy risk | Occupancy stood at 83.7% in Q2 FY27. Lower occupancy could reduce revenue and profit | Overall portfolio occupancy stood at 76.2% in Q2 FY27, while older centres recorded 84.1%. New centres needs to improve occupancy |
| Expansion risk | Its total area reached 13 million sq. ft. in Q2 FY27, of which 9.8 million sq. ft. was operational. It needs to fill and operate the remaining space | Added six centres during Q2 FY27, taking its network to 254 centres with around 1.74 lakh seats. New centres may take time to reach good occupancy |
| Price and profitability | The company needs to maintain occupancy and rental income while managing lease and operating expenses to protect its EBITDA margins | Charges around 35% more than its flagship products. It needs to maintain customer demand for these premium spaces while improving occupancy |
| Dependence on corporate clients | Enterprise clients contributed 77% of core revenue. A lower corporate demand for office space could affect revenue | Relies on demand from large corporates, MNCs and multi-centre clients. A slow corporate demand could affect new bookings and seat occupancy |
Which Investor Profile Suits Awfis vs WeWork India
| Particulars | WeWork India | Awfis |
| Investors looking for higher occupancy | Suitable for its higher reported occupancy of 83.7% in Q2 FY27 | Investors tracking occupancy improvement, as overall occupancy was 76.2% |
| Investors looking for established operations | Investors who prefer a larger operational portfolio of 1.45 lakh desks across 85 centres | Investors looking for a wider network of 254 centres across 18 cities |
| Investors interested in premium workspaces | Exposure to enterprise-focused flexible workspaces, with clients contributing 77% of core revenue | Investors looking for premium workspace growth. Its Gold and Elite portfolio reached 39 centres |
| Investors tracking profitability | Reported Q2 FY27 EBITDA of ₹162.9 crore and ROCE of 34.5% | Reported Q2 FY27 EBITDA of ₹174 crore, up 31% year-on-year |
| Investors tracking GCC demand | GCCs contributed around 41% of its overall business mix | Served more than 105 GCC clients, contributing around 24% of rental revenue |
WeWork India may appeal to investors who prioritise higher occupancy and a larger operational business. Awfis may interest investors who want exposure to premium workspaces, GCC demand and network expansion. Both require investors to monitor lease commitments, occupancy and the cost of adding new centres.
FAQs
WeWork India has reported revenue of ₹766.5 crore in Q2 FY27, up 32.5% year-on-year. Its EBITDA increased 37.6% to ₹162.9 crore, while profit after tax (PAT) rose 67.4% to ₹65.8 crore. Therefore, its portfolio occupancy stood at 83.7%, with 1.45 lakh operational desks around 85 centres.
In Q2 FY27, Awfis recorded a revenue of ₹439 crore, up 20% year-on-year. Its reported EBITDA increased 31% to ₹174 crore, while PAT rose 93% to ₹31 crore. Thus, the overall portfolio occupancy stood at 76.2%, with 1.64 lakh operational seats across 244 centres.
WeWork India’s PAT increased 67.4% year-on-year to ₹65.8 crore. The rise was supported by higher revenue and EBITDA, which grew 32.5% and 37.6%, respectively. The company also improved its operating performance as it added desks and maintained higher occupancy. Its EBITDA grew faster than revenue, indicating better operating profitability.
The main risks include long-term lease commitments, low occupancy, rising rental costs and slower corporate demand. Companies must pay rent even when some desks remain vacant. Rapid expansion can also increase fit-out costs before new centres start generating enough revenue. Investors should also check client concentration, debt levels, promoter share pledging and cash flows before comparing coworking stocks.