With so many charts and timeframes in an average TradingView screen, it’s no surprise that trading feels overwhelming to most beginners. Understanding these screens can sometimes feel like solving a cryptic message, and it can be – especially when the charts change with time frames.
In this article, we’re going to dive into what different time frame charts mean for the same stock, which one you should pick for which circumstance, and what the advantages of picking the weekly chart are.
You may also like: Mastering renko charts: Strategies to improve your trading
What are weekly charts?
Simply put, weekly charts represent the movement in price of a stock or security over a week. These charts are a collection of the high, low, open, and close prices of a specific asset for each week, offering a broader perspective than daily charts but less granular detail than monthly charts.
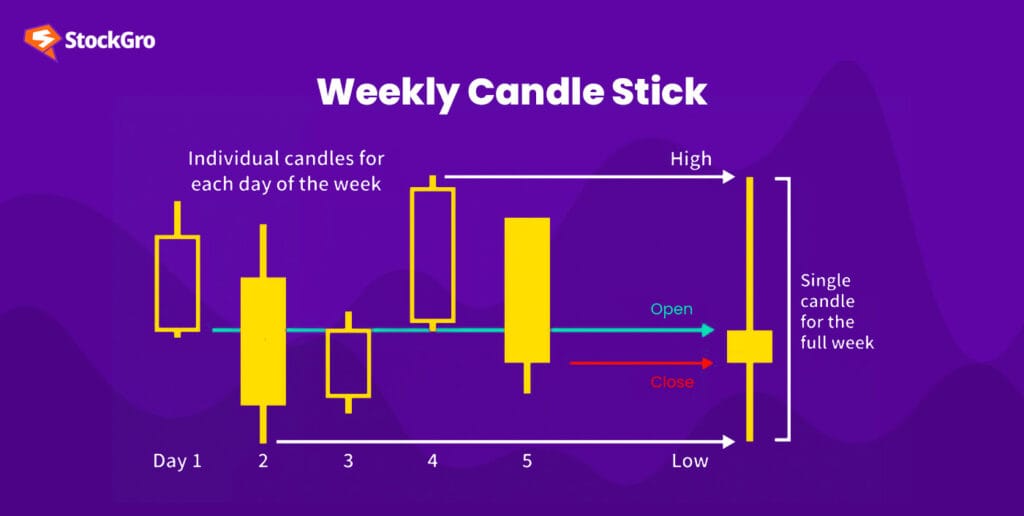
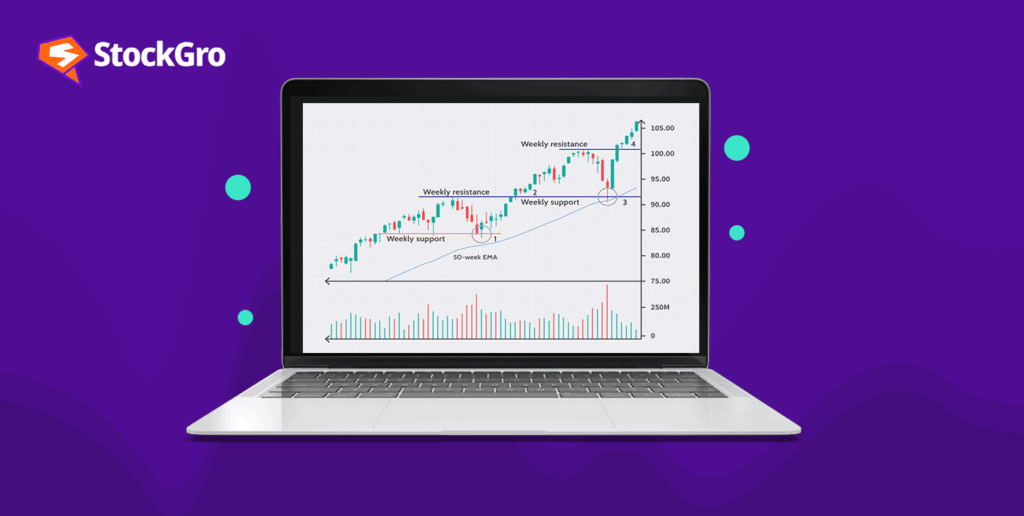
Like you can see above, every candle on the weekly chart represents one week of price movement. Since this is a longer time horizon for stocks than a daily candle, weekly charts are used more frequently to gauge the long-term trend of the asset.
When compared to a daily chart, a weekly chart seems more stable. Although it obviously accounts for all the volatility in the market, every price movement every week isn’t shown, which makes for a more stable representation of price. This, hence, makes it easier for traders to spot long-term trends in price movement and take bets accordingly.
Summary:
- Timeframe: Each data point represents the price action for an entire week.
- Price data: High, low, open, and close prices are plotted for each week.
- Visual appearance: Weekly charts often use candlesticks or bars to represent price movement. They look more stable than the daily chart because they net the action in the stock over a week rather than representing every movement.
- Use cases: Analysing trends, identifying support and resistance levels, and making long-term investment decisions.
Also read: Relative strength index (RSI): A complete guide for traders
Advantages of using weekly charts
There are several advantages to using weekly charts:
- Reduced noise: Daily charts can be cluttered with minor price fluctuations, making it difficult to identify underlying trends. Weekly charts smooth out these fluctuations, providing a clearer picture of the overall market direction. This is especially useful for investors who buy stocks based on fundamental analysis because they provide an improved focus on long-term trends.
- Better technical analysis too: Weekly charts aren’t just for the buy-and-hold category; they are valuable for technical investors too. Moving averages and trendlines, for instance, are more effective when applied to weekly charts.
- Psychological trading: By getting stuck up on little price movements every second, traders can become pessimistic about their positions, often giving them up early or taking losses instead of waiting. By looking at larger trends in the market, you can mitigate impulsive trading decisions.
Advantages of weekly charts over other charts
Here is a table that summarises the advantages of weekly charts over a daily chart and a monthly chart:
| Feature | Monthly | Weekly | Daily |
| Timeframe | 1 month | 1 week | 1 day |
| Data points | 30-31 | 5 | 1 |
| Detail | Low | Medium | High |
| Trend analysis | Good | Good | Difficult |
| Technical analysis | Moderate | Good | Excellent |
| Noise | Low | Moderate | High |
| Best for | Long-term trends | Long-term trends, technical analysis | Short-term trading, intraday analysis |
| Overall | Good for long-term perspective | Best balance of detail and breadth | Good for short-term analysis |
While daily charts offer high detail and monthly charts provide a broad perspective, weekly charts offer the best balance for most investors seeking a clear view of trends and technical analysis opportunities.
Also read: Understanding the accumulation distribution indicator
Conclusion
In conclusion, weekly charts offer the best balance between detail and breadth for most investors. They effectively capture long-term trends, filter out noise, and provide a solid foundation for technical analysis. So, if you’re looking for a clear view of the market and want to avoid impulsive decisions, give weekly charts a try.