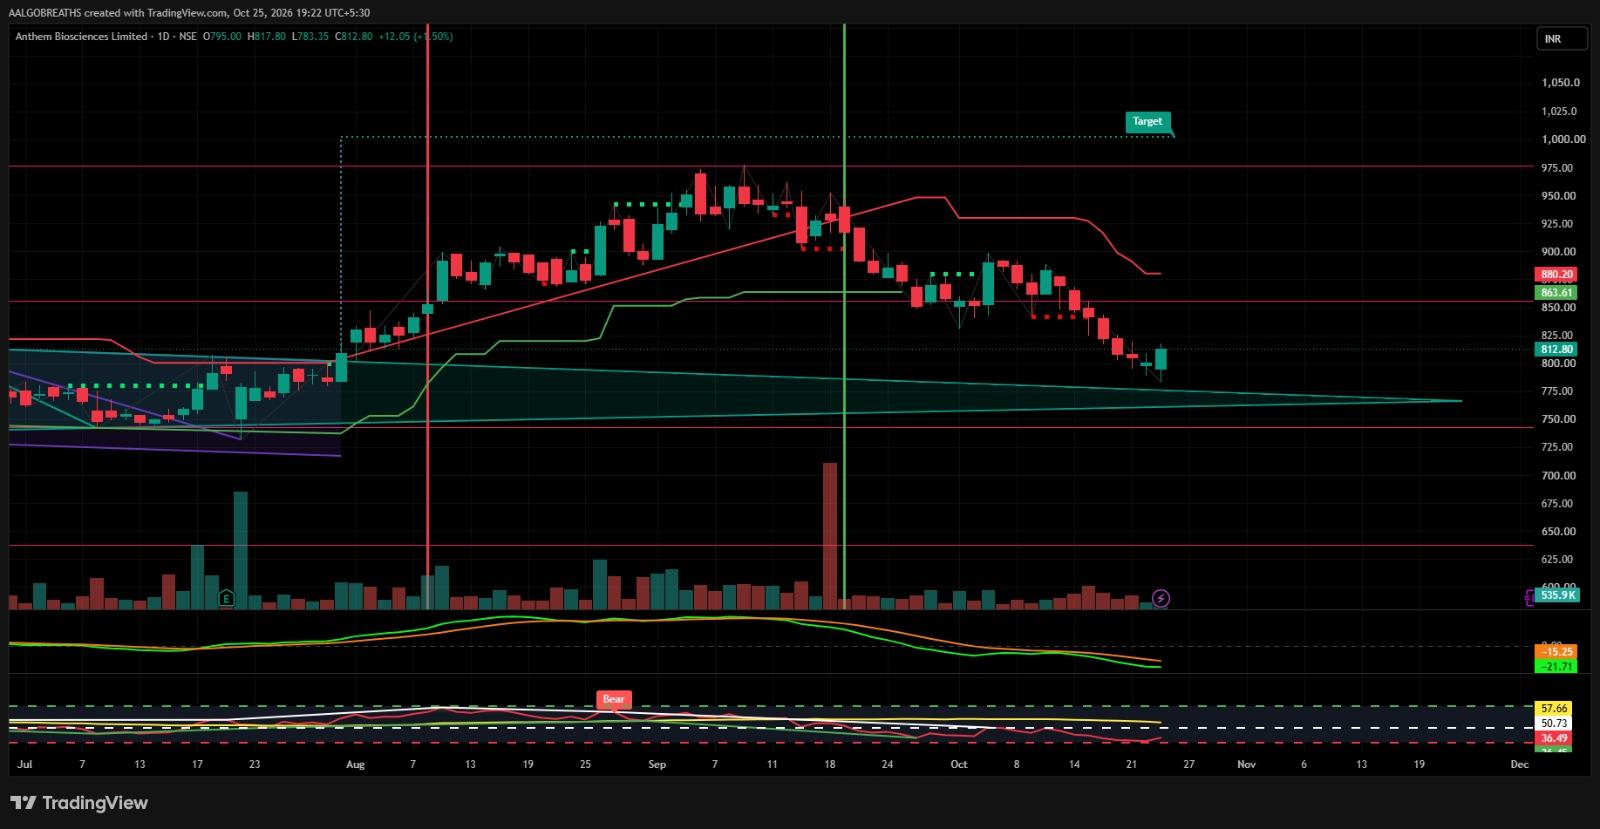
Adani Green Energy is attempting to recover near key support zones, but a confirmed bullish reversal is still awaited. The current technical setup indicates a potential recovery opportunity, although confirmation through a decisive breakout and strong volume participation remains essential.
🔑 Support Zones: ₹1,217–₹1,186 | ₹1,155–₹1,125
🚧 Resistance Zones: ₹1,247–₹1,278 | ₹1,309–₹1,341
🎯 Potential Upside Levels: ₹1,341 | ₹1,462 | ₹1,554–₹1,585
📈 Technical View: The stock is showing signs of attempting a recovery near its important support region. A sustained breakout above ₹1,278, supported by strong trading volume, could strengthen the bullish reversal setup and open the possibility of an upward move towards ₹1,309–₹1,341. If the stock manages to cross this resistance zone decisively, the next potential levels to monitor would be ₹1,462, followed by ₹1,554–₹1,585.
⚠️ Risk Factors: The stock must sustain above the identified support zones to maintain its recovery prospects. A breakdown below ₹1,186 could increase selling pressure and expose the lower support region of ₹1,155–₹1,125. Traders should closely monitor price action, breakout confirmation, and volume before drawing directional conclusions.
Disclaimer: This technical analysis is intended solely for educational and informational purposes. The levels mentioned represent potential technical zones and are not guaranteed targets. This post does not constitute investment advice or a buy/sell recommendation. Please conduct your own research and follow appropriate risk-management practices.
— AALGO BREATHS 📊