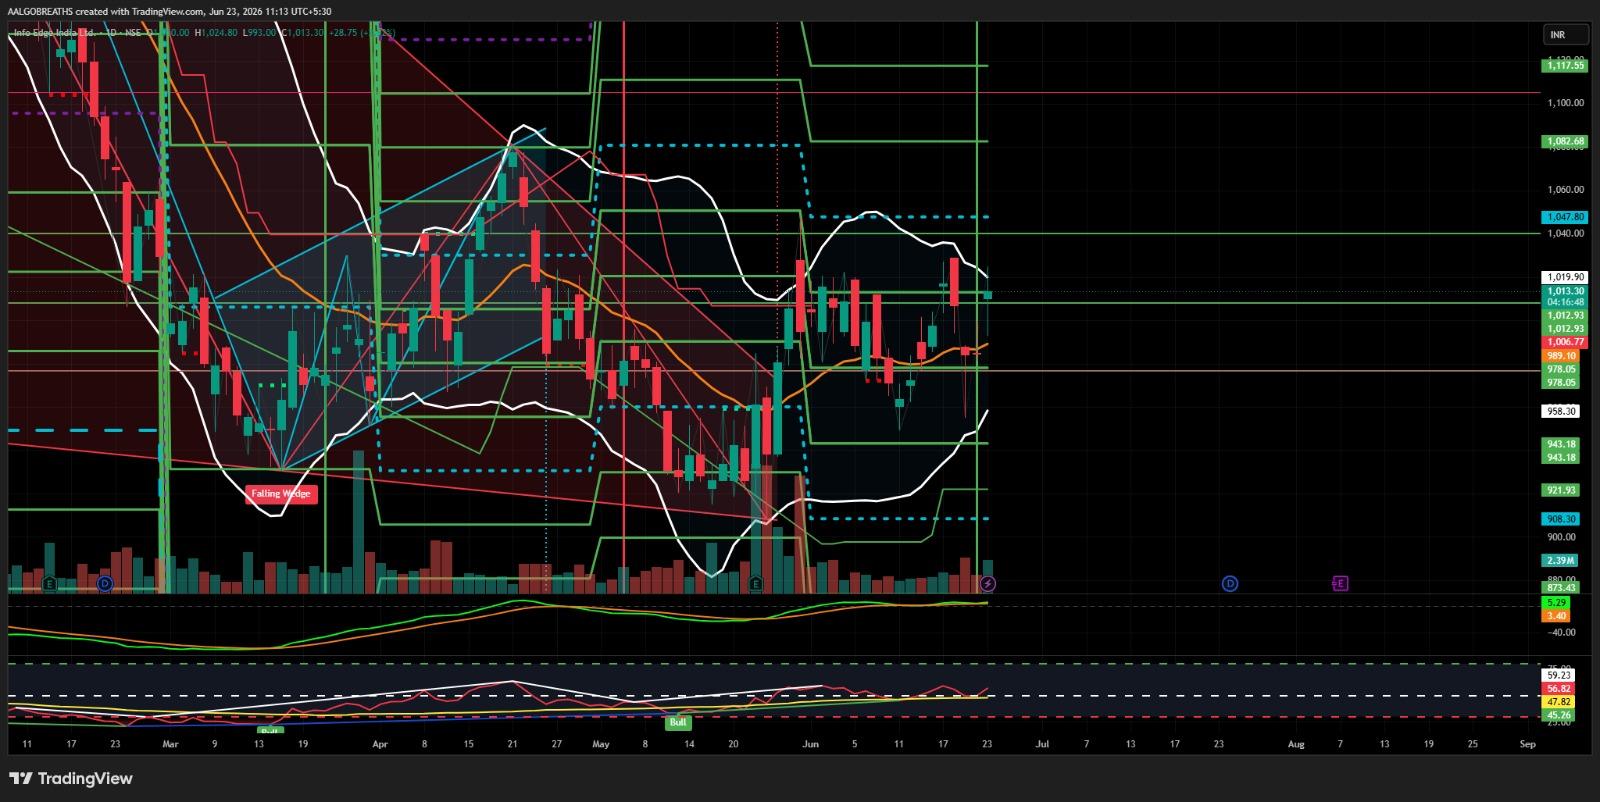
IFB Industries Ltd – Recovery After Correction
$IFBIND The stock is showing signs of recovery after a prolonged correction, with price rebounding from lower support zones and momentum improving. 🔎 Technical Setup: • Falling wedge breakout attempt visible • Price reclaiming short-term moving averages • Buying interest emerging near support zone • RSI gradually strengthening above neutral levels • Volatility contraction hints at a potential directional move 🔑 Key Levels: • Support: ₹989 – ₹978 • Major Support: ₹943 – ₹921 • Resistance: ₹1,020 – ₹1,048 🚀 Upside Targets: • ₹1,048 • ₹1,083 • ₹1,117+ ⚠️ Risk: A close below ₹978 may weaken the recovery setup and invite fresh selling pressure. 📈 View: Sustained move above ₹1,020 can trigger further upside momentum toward higher resistance zones. For educational purposes only. Not a buy/sell recommendation. — AALGO BREATHS 📊