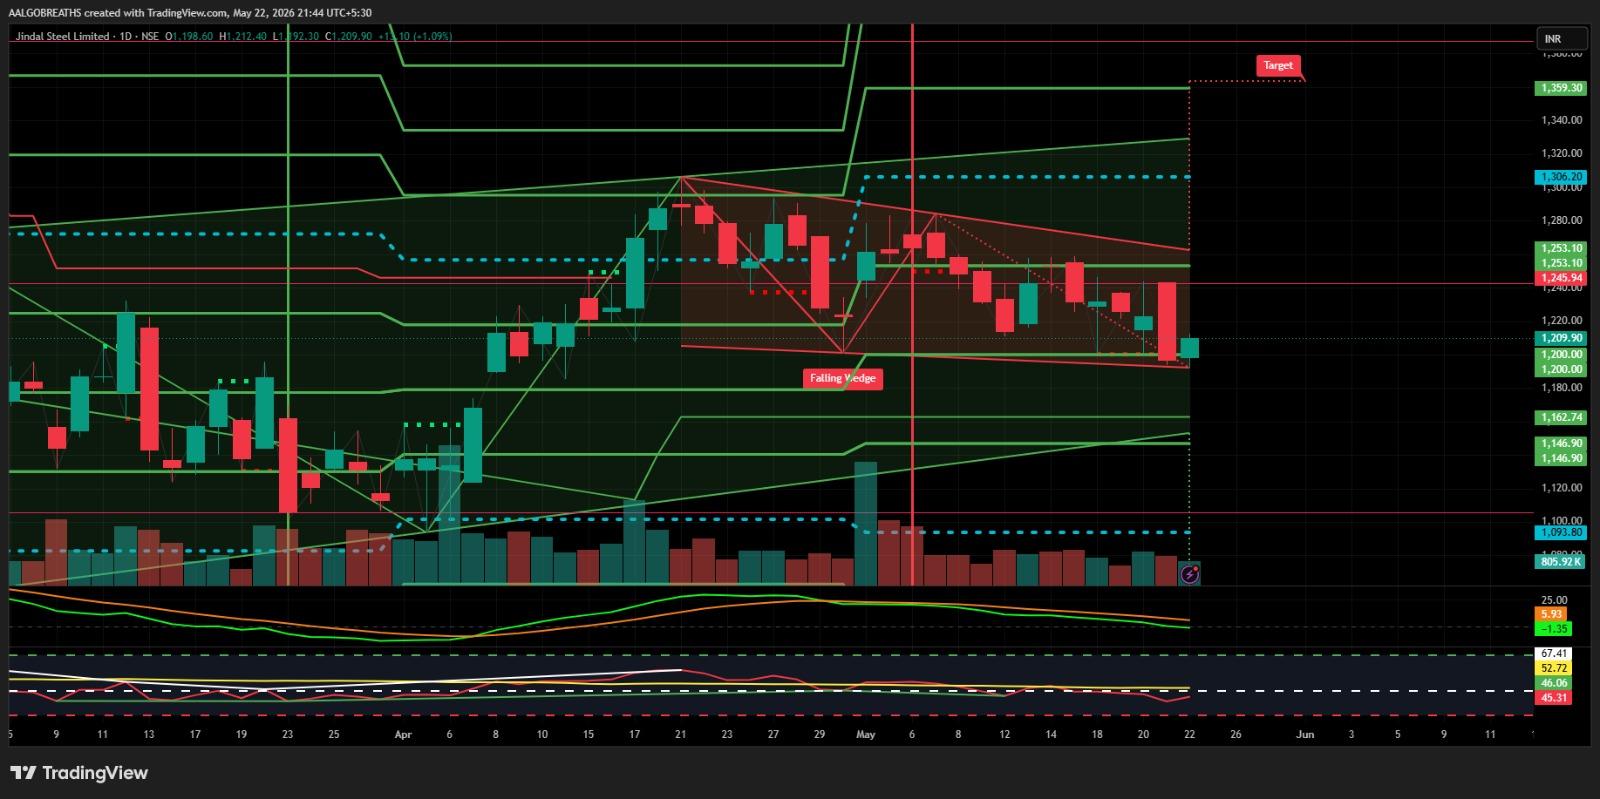
Jindal Steel is currently trading inside a falling wedge pattern on the daily timeframe
$JINDALSTEL According to the chart, Jindal Steel is currently trading inside a falling wedge pattern on the daily timeframe, which is generally considered a bullish reversal structure if a breakout occurs. The stock is attempting to stabilize near the lower support zone around 1200. Key levels from the chart setup: Immediate Support: 1200 → 1180 zone Major Support: 1160 → 1093 zone Immediate Resistance: 1245 → 1253 Breakout Resistance: 1306 Bullish Target Zone: 1359+ Current observations: Price is consolidating near the lower wedge boundary, indicating possible base formation. RSI is in a neutral zone and trying to recover from lower levels. Selling pressure has reduced compared to earlier sessions. Volume confirmation is still missing for a strong breakout. A sustained move above 1245–1253 can trigger fresh bullish momentum. Trading View: Swing Buy above: 1255 closing basis Strong breakout confirmation above: 1306 Upside targets: 1359 / 1400 zone Bearish continuation below: 1200 Downside targets: 1180 / 1160 From a risk-reward perspective, the structure still favors a potential bullish reversal as long as 1200 support holds. However, traders should wait for breakout confirmation before taking aggressive long positions.