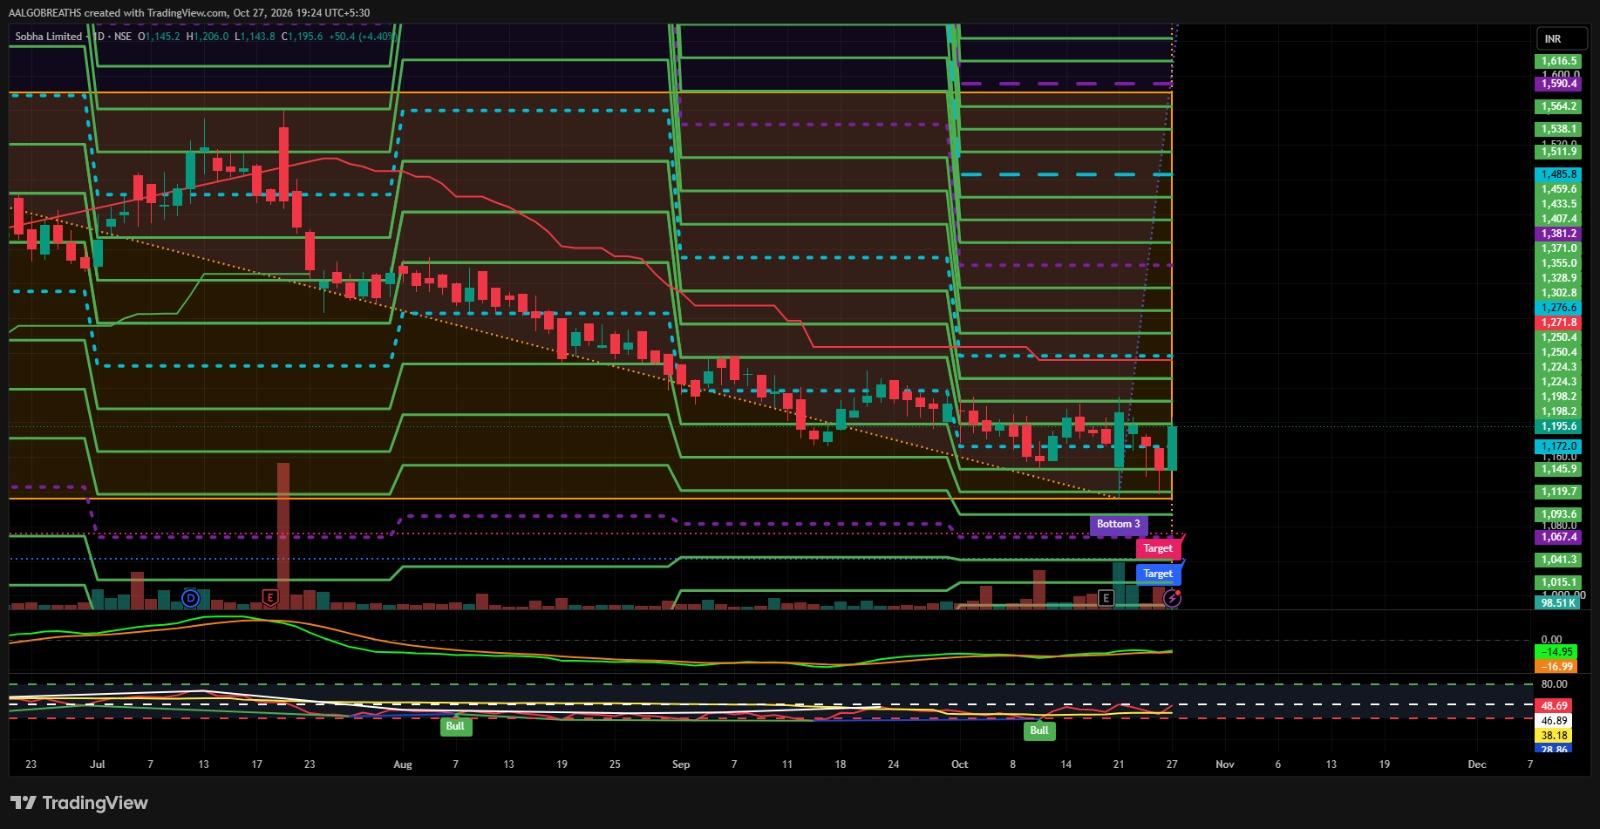
Sobha Limited is currently trading around ₹1,195.60, registering a strong daily gain of approximately 4.40%. The stock has been under sustained selling pressure over the past few months, declining from higher levels and forming a broader bearish structure. However, the recent price action indicates a possible short-term recovery attempt from the ₹1,145–₹1,160 support zone. The latest bullish candle suggests renewed buying interest, although confirmation of a trend reversal is still required.
🔑 Key Support Levels: ₹1,172 | ₹1,145 | ₹1,120 | ₹1,094
🚀 Key Resistance Levels: ₹1,198–₹1,224 | ₹1,250 | ₹1,276 | ₹1,303
📈 Technical Outlook: The stock is attempting to stabilise after a prolonged decline. The momentum indicators show some improvement, with the RSI moving towards the neutral zone, indicating a potential recovery in buying momentum. Nevertheless, the price is still facing resistance around ₹1,198–₹1,224, which will be an important zone to watch. A sustained breakout above this range could open the possibility of further upside towards ₹1,250 and ₹1,276. On the downside, a failure to hold above ₹1,172 may lead to renewed selling pressure, while a decisive break below ₹1,145 could weaken the recovery setup and expose lower support levels.
Conclusion: Sobha Limited is showing early signs of a short-term rebound, but the broader trend remains cautious until stronger resistance levels are decisively breached. Traders should monitor price action around the immediate resistance zone and wait for breakout confirmation before considering fresh bullish positions. Proper stop-loss discipline and risk management remain essential.