SUPREME INDUSTRIES LTD – Technical Analysis Report
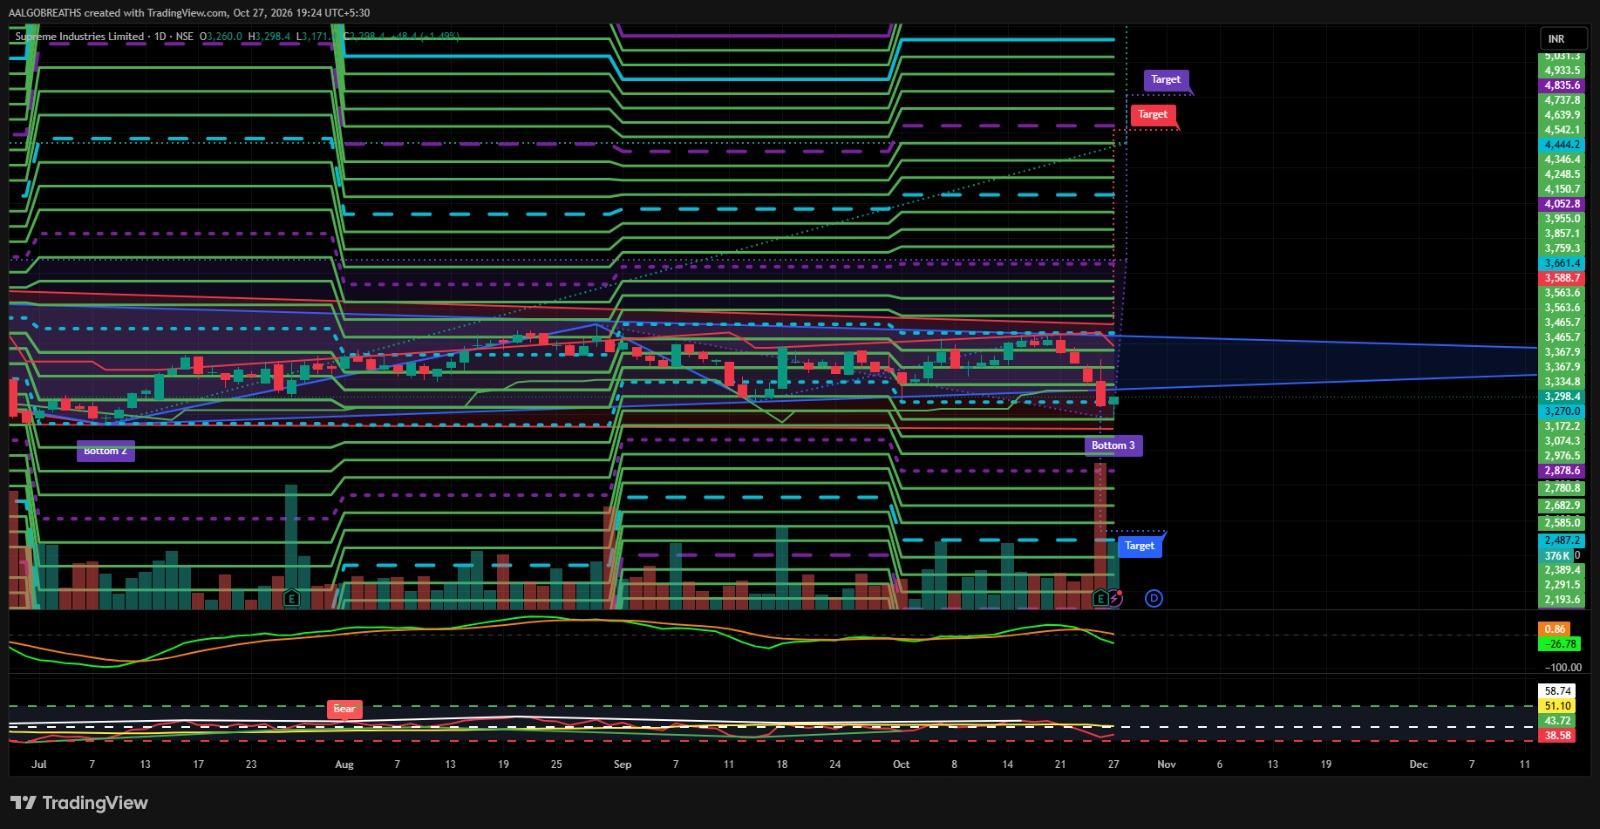
Technical View: Supreme Industries is showing signs of weakness after facing resistance near the ₹3,400–₹3,465 zone. The stock has recently witnessed selling pressure, with bearish momentum emerging on the daily chart. Price action suggests that the stock is testing an important support area, and a decisive recovery will be required to improve the near-term outlook.
Key Support Zones: ₹3,270–₹3,172 | ₹3,074–₹2,976
Resistance Zones: ₹3,335–₹3,367 | ₹3,465–₹3,563
Potential Upside Levels: ₹3,367 | ₹3,465 | ₹3,588
Technical Outlook: The stock is currently trading near ₹3,298, close to the lower boundary of its recent price structure. Sustaining above ₹3,270–₹3,172 may help stabilise the price and create scope for a recovery towards ₹3,367 and ₹3,465. However, a sustained move above ₹3,465, supported by strong volume, would be required to strengthen the bullish outlook. On the downside, a decisive breakdown below ₹3,172 could increase selling pressure and expose the lower support zones around ₹3,074–₹2,976. Momentum indicators also suggest caution, making confirmation from price action and volume particularly important.
Risk Management: Traders should avoid assuming a reversal until the stock shows a sustained recovery above immediate resistance. Position sizing and stop-loss discipline remain essential in the current setup.
Disclaimer: This report is based on the technical chart provided and is intended solely for educational and informational purposes. The levels represent potential technical zones, not guaranteed targets or assured outcomes. This is not investment advice or a buy/sell recommendation. Investors should assess their risk tolerance and conduct independent research before making any investment decision.
— AALGO BREATHS 📊
#FundamentalViews#TechnicalViews#WatchOutFor#StockInNews#EquityResearch

 Equity Research
 Fundamental Views
 Hidden Gems
 Index Strategies
 International Market
 IPO
 Macro Views
 Miscellaneous
 Personal Finance
 Post-Closing Commentary
 Pre-Opening Commentary
 Psychology of Money
 Sector Breakout
 Stock In News
 Technical Views
 Time To Exit
 Today's Trading Setup
 Trending Sectors
 US Market
 Watch Out For