SHYAM METALICS & ENERGY LTD. – Technical Analysis Report
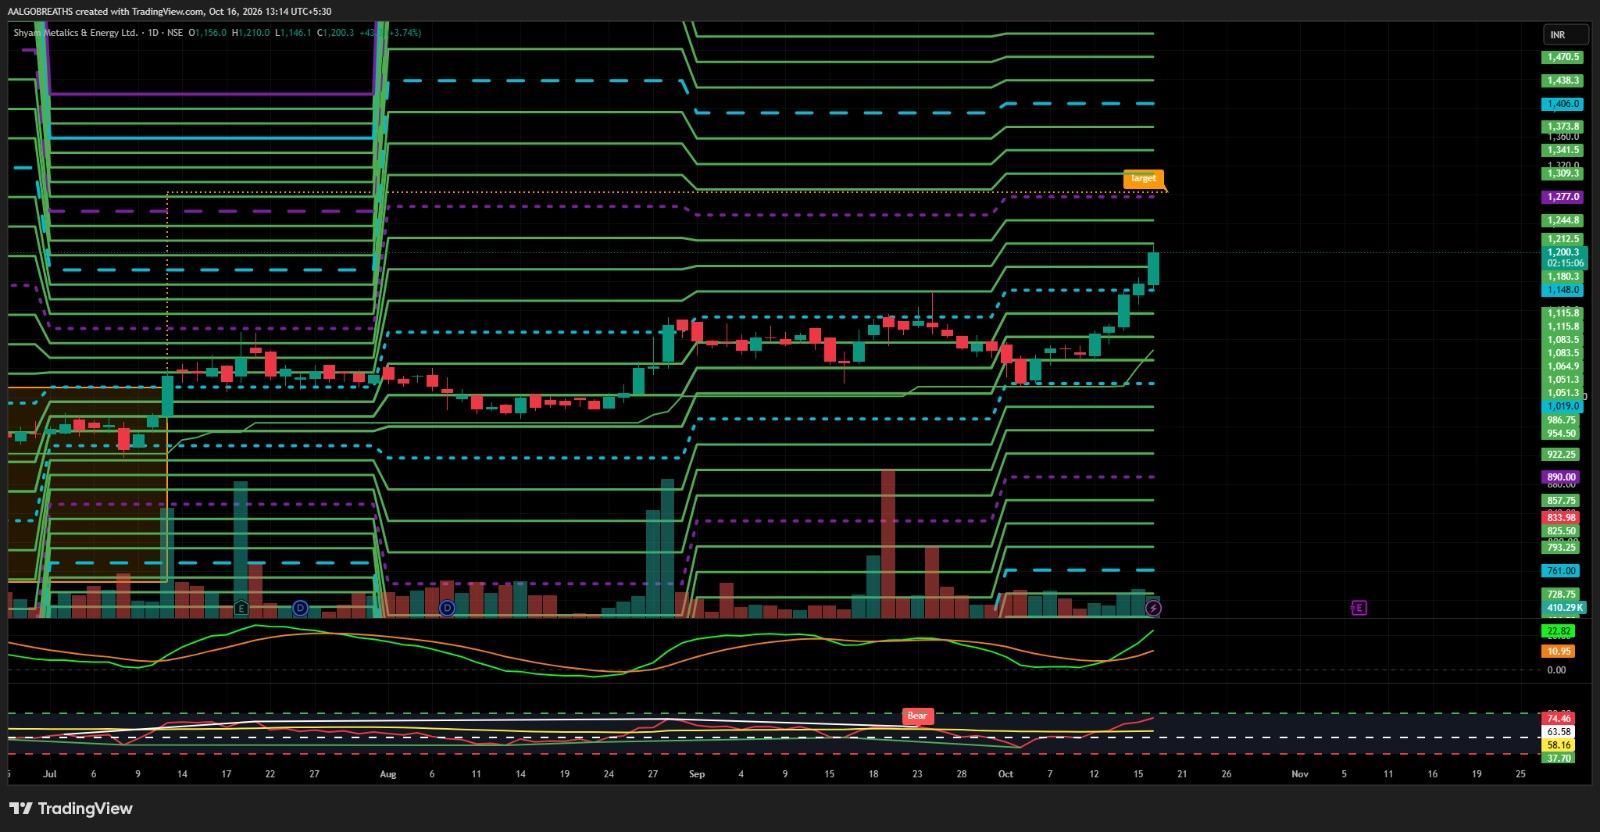
SHYAMMETL Shyam Metalics & Energy Ltd. is demonstrating strong bullish momentum on the daily chart, with the stock trading near ₹1,200.30. The latest price action shows a sharp upward move following a period of consolidation, supported by consecutive bullish candles and improving buying interest. The stock has moved above several near-term resistance levels, indicating strengthening short-term momentum. However, after this sharp rally, some consolidation or profit booking may occur. 🔎 Technical View: The chart indicates a positive short-term structure, with price action suggesting a potential continuation of the recovery. Momentum indicators are turning upward, while recent candles reflect increased buying activity. Sustaining above the immediate breakout zone will be important to maintain the current bullish bias. Traders should also monitor volume and price stability to assess the strength of the ongoing move. 🔑 Key Technical Levels: Current Reference Price: ₹1,200 Immediate Support: ₹1,180–₹1,148 Secondary Support: ₹1,115–₹1,083 Major Support: ₹1,051–₹1,019 Immediate Resistance: ₹1,212–₹1,244 Major Resistance: ₹1,277–₹1,309 Higher Resistance: ₹1,341–₹1,406 📈 Potential Outlook: If the stock sustains above ₹1,200–₹1,212 with supportive volume, it may attempt to move toward ₹1,244 and ₹1,277. A sustained breakout above ₹1,277–₹1,309 could strengthen the bullish structure and open the possibility of further upside toward ₹1,341 and higher resistance zones. Conversely, a move below ₹1,148 may indicate weakening momentum, while a decisive break below ₹1,083 could increase the risk of a deeper pullback toward ₹1,051–₹1,019. For educational and informational purposes only. This report is not a buy or sell recommendation. — AALGO BREATHS 📊