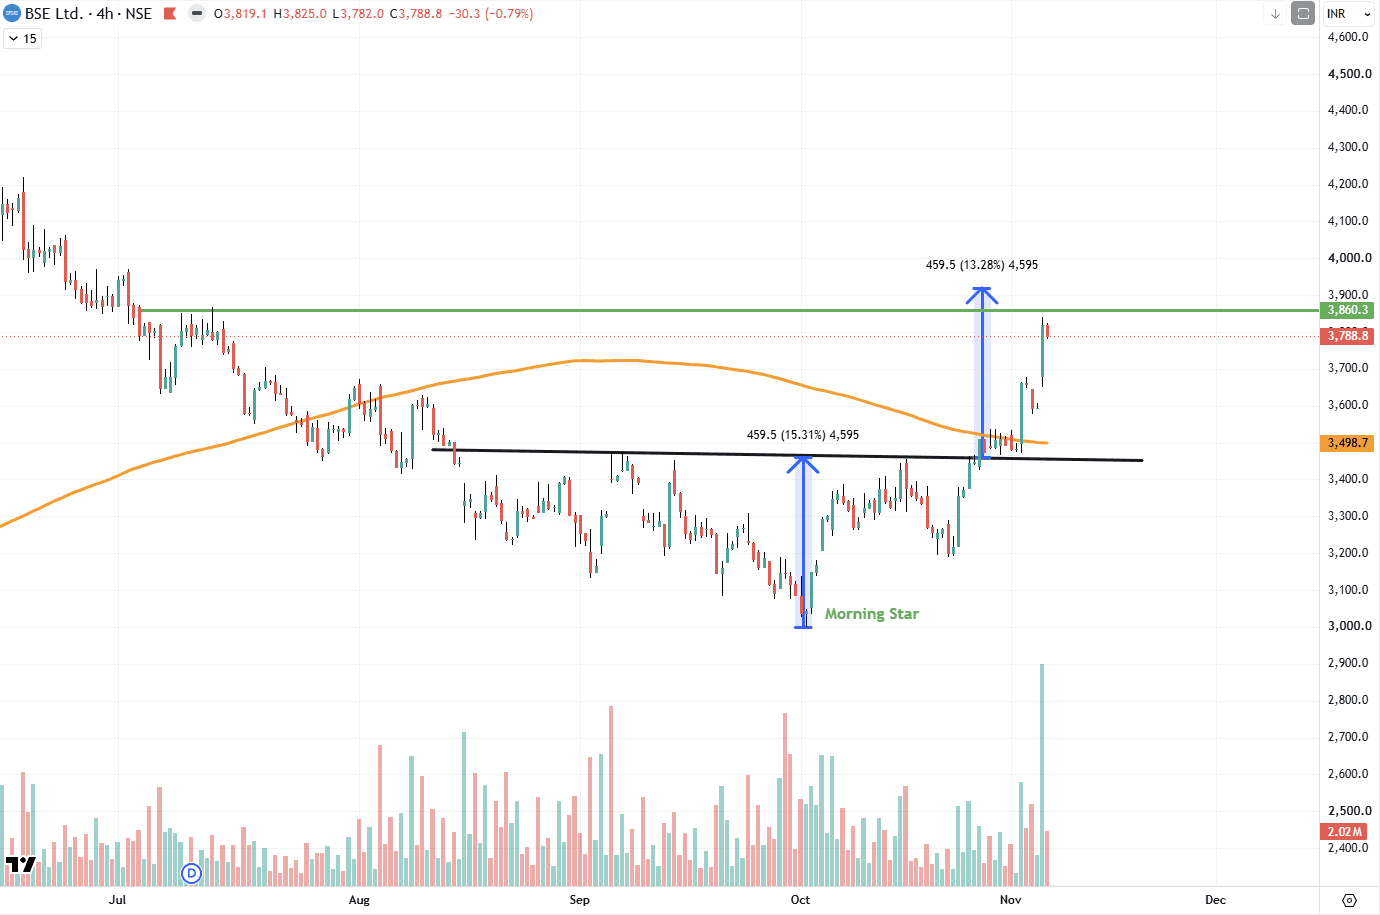
BSE Update: Breakout Extends; 3,860 in Focus
On 28 Oct we had highlighted BSE ’s move above the trendline after a Morning Star formation near the lows. Since then the stock has extended from around 3,500 to about 3,790 on the 4-hour chart, a gain of roughly 8%. The move cleared the 4-hour 200 SMA near 3,499 and the former resistance trendline near 3,460, and volume rose sharply on the latest up-leg. The stock is now approaching the 3,860 zone, which was a swing high in July and August and is the nearest resistance on the chart. The base-to-breakout depth of about 460 points gives a measured-move reference near 3,920, which is a reference only and not a forecast. The latest candle is a small red one after the sharp advance, so some consolidation would not be unusual. The 3,500 zone, where the SMA and the old trendline meet, is the level to watch on the downside. How BSE reacts near 3,860, and whether volumes stay supportive, is worth observing. After a breakout, former resistance often becomes support; rising volume and holding that zone help judge whether the move has follow-through. Disclaimer: This is for educational purposes only and is not investment advice. Please consult your financial advisor before making any investment decisions. SEBI Registered Research Analyst — INH000025212.