3 hours ago · SEBI Registration INH000025212
SEBI Registration INH000025212 · 3 hours ago
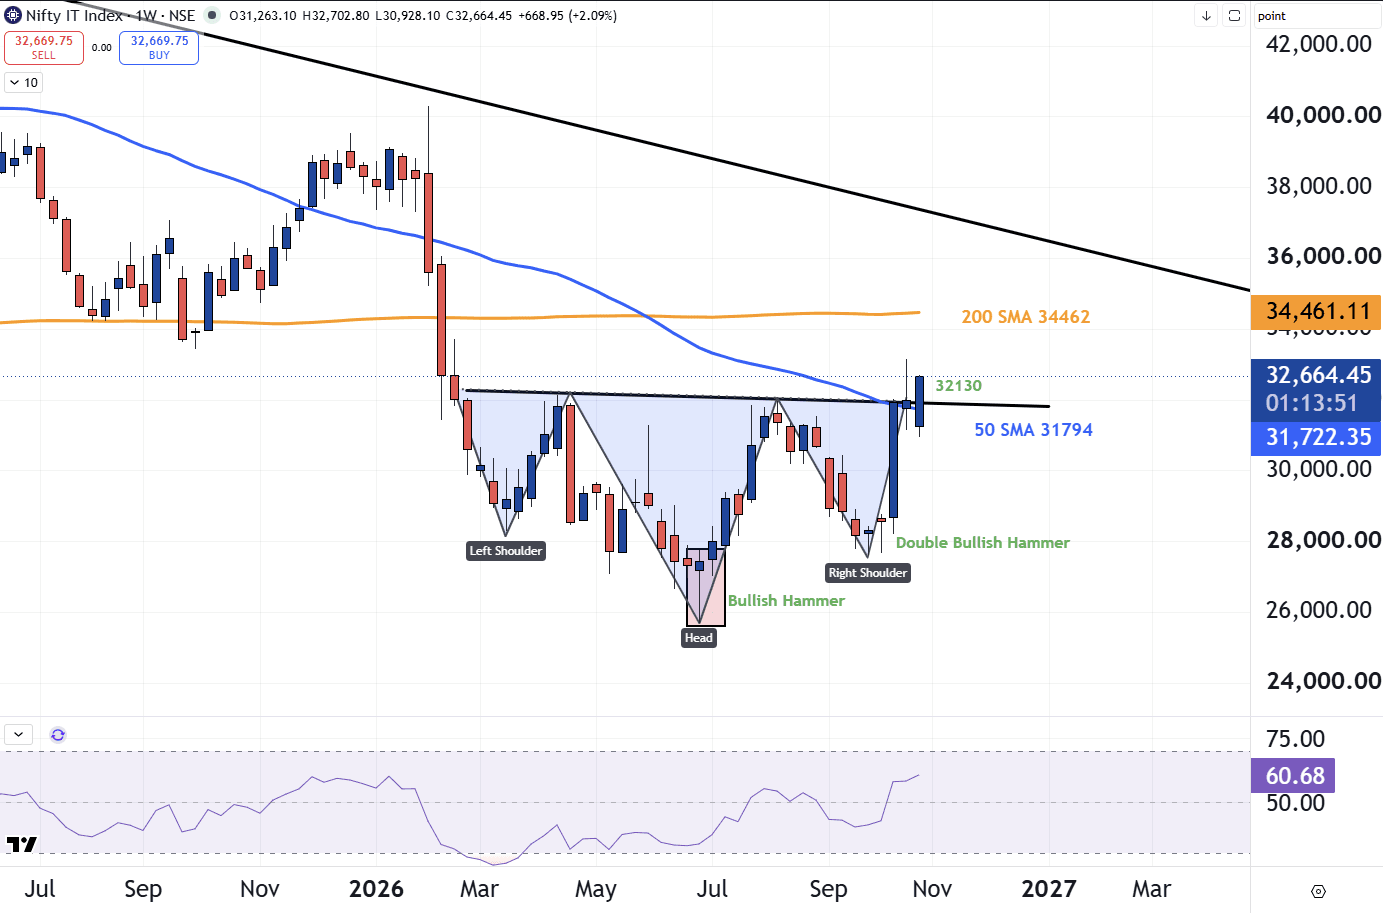
Nifty IT Holds Above Neckline on Weekly Close
Nifty IT closed the week near 32,600, above the neckline of its inverse Head & Shoulders pattern near 32,130. The structure is clear on the weekly chart. There is a left shoulder from March and a head near mid-year marked by a Bullish Hammer. The right shoulder was supported by a Double Bullish Hammer. The 50 SMA near 31,800 now sits just below price, and RSI near 61 shows improving momentum without being overbought.
Since today is the weekly close, how the index trades next week after this breakout is worth observing. A sustained hold above the neckline would keep the pattern intact, while a close back below it would weaken the structure. If strength continues, the 200 SMA near 34,460 is the next major reference on the chart, with a falling trendline higher up. After a long weak phase, whether the IT drought ends is the question. Heavyweights like