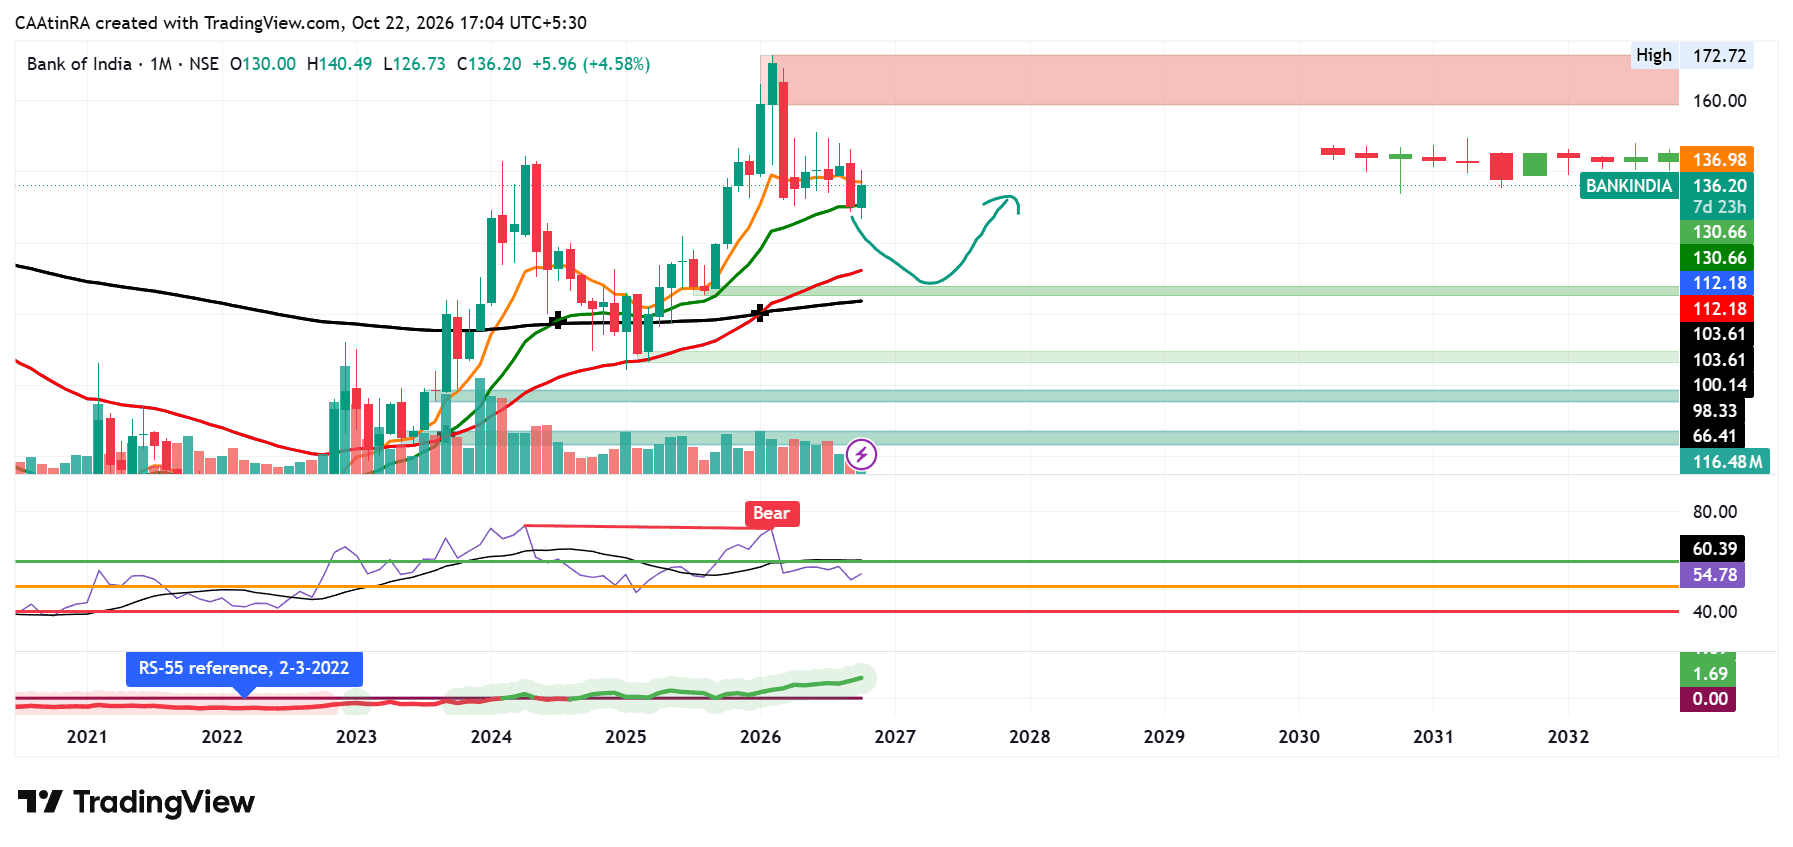
Bank of India is a public sector banking institution with operations across retail banking, corporate banking, agriculture finance and other financial services.
As of 21 October 2026, the share closed at approximately ₹137.70 on the NSE. Its reported 52-week high was ₹178.45, while the 52-week low was ₹126.75. The share is therefore trading well below its annual high, making it important to assess whether the recent price action represents a recovery or merely a temporary rebound.
2. Fundamental Analysis
Financial performance: Bank of India reported standalone net profit of ₹10,527 crore for FY2025–26, compared with ₹9,219 crore in FY2024–25, representing growth of approximately 14.2%. This indicates an improvement in annual profitability.
As of 21 October 2026, technical indicators showed the share near ₹138.04, with RSI around 52.9. The price was above its 20-day EMA but close to its 50-day EMA, while the 100-day and 200-day EMAs remained overhead. This suggests improving short-term momentum, but the broader recovery still needs confirmation.
ET Money
Technical level Price (₹)
Immediate support 134
Next support 131
Stronger support zone 126–129
Immediate resistance 138.5–140
Next resistance 143
Higher resistance reference 146–147
Bank of India’s September 2026 quarterly results are scheduled for consideration on 23 October 2026. This is an important near-term event that could affect volatility and the next price direction.
Key Insights - Screener
+1
Investors should watch:
- Net interest income and net interest margin.
- Deposit and advance growth.
- Gross and net NPA trends.
- Provisioning requirements and capital adequacy.
- Price movement and trading volume after the results announcement.