5th Jun · SEBI-Registered Analyst
Currency Grow (CA & SEBI Reg IA Omkar Bhutada) · 5th Jun
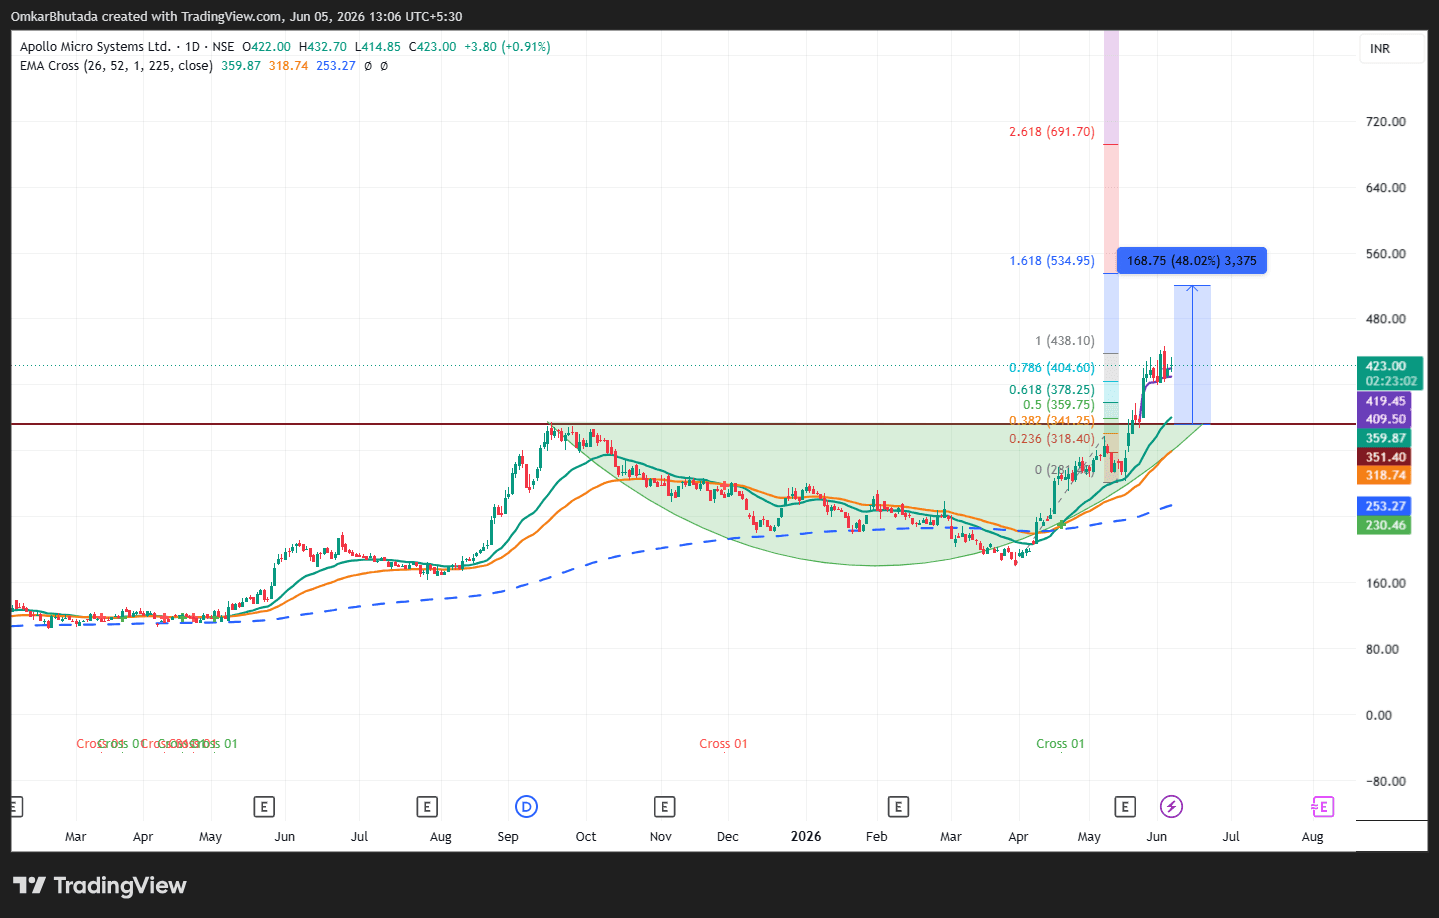
Apollo Micro Systems (Daily Chart) – Technical Analysis
$APOLLO 1. Pattern Identification This is a very constructive chart showing multiple bullish factors: A Cup & Handle breakout has already occurred above the ₹350–360 resistance zone. Price has successfully retested and held the breakout area. The stock is trading above: 26 EMA (₹359) 52 EMA (₹319) 225 EMA (₹253) The EMA structure is fully bullish: 26 EMA > 52 EMA > 225 EMA This indicates a strong trend environment. 2. Current Structure The chart shows: Neckline breakout around ₹350 Current price around ₹423 Recent consolidation just below previous swing high at ₹438 The stock is now attempting a fresh expansion leg after completing the retest. Aggressive Entry ₹410–425 Suitable while price remains above the breakout structure. Conservative Entry Wait for: Breakout above ₹438 Retest of ₹438–445 zone This would provide confirmation of the next trend leg.