27th May · SEBI-Registered Analyst
Currency Grow (CA & SEBI Reg IA Omkar Bhutada) · 27th May
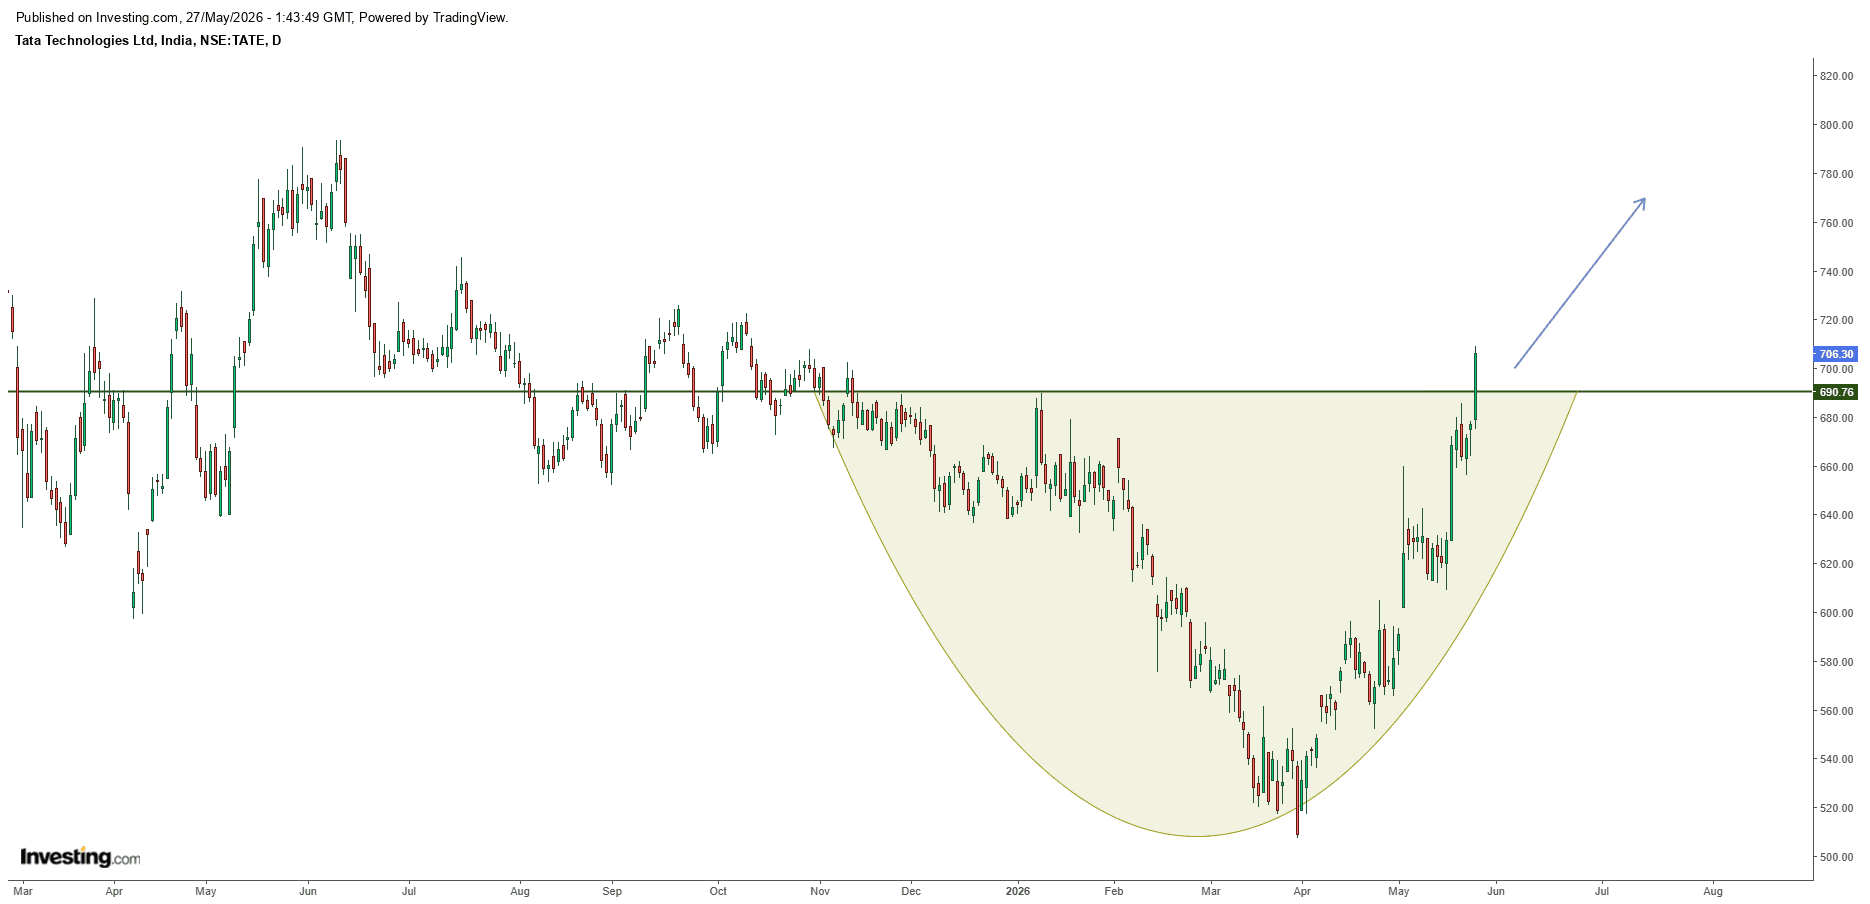
Breakout + Cup Formation Signaling Potential Upside in Tata Technologies
$TATATECH Tata Technologies appears to be showing a strong technical setup with multiple signals aligning after a prolonged consolidation phase. Technical View: • The chart reflects a large Cup pattern breakout, with price decisively reclaiming the key resistance zone around ₹690 after several months of sideways action. A successful breakout above this supply area suggests a possible continuation toward higher levels. • From an Elliott Wave perspective, the stock may have completed a corrective phase and could be entering an impulsive advance, potentially initiating a fresh Wave 3 structure — often considered the strongest phase in trend expansion. • MACD structure is likely supporting the move with a bullish crossover and positive momentum divergence, indicating strengthening buying pressure after a prolonged base formation. • AVWAP analysis suggests the breakout zone around ₹690 can now act as an important support level. Sustaining above this area strengthens the bullish structure and may convert previous resistance into demand. Fundamental Snapshot: The company operates in a niche engineering and digital transformation space with a scalable business model. Strong client relationships, improving operational metrics, and a healthy growth outlook add support to the broader bullish structure. What makes this interesting? A multi-month base breakout combined with pattern completion, momentum confirmation, and improving structure often creates favorable risk-reward opportunities. Charts indicate probability, not certainty. Price behavior around the breakout zone remains important.