3rd Jun · SEBI-Registered Analyst
Currency Grow (CA & SEBI Reg IA Omkar Bhutada) · 3rd Jun
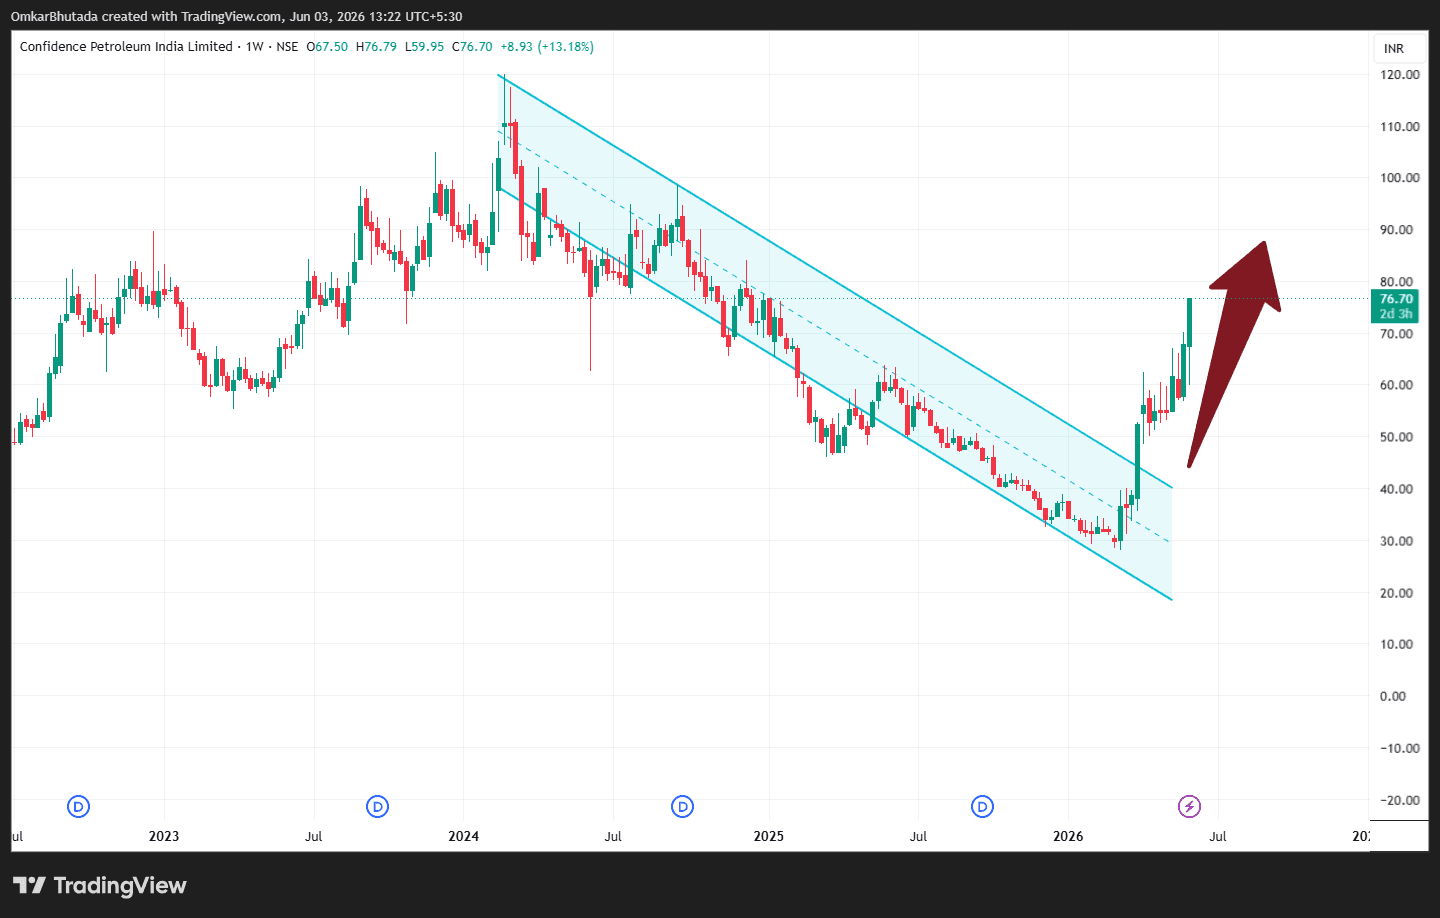
Confidence Petroleum India Ltd. (Weekly Chart) – Technical Analysis
$CONFIPET 1) Pattern Identification This chart is showing a bullish breakout from a long-term Falling Channel. Key observations: Price remained trapped inside a downward sloping channel for nearly 2 years. The recent rally has produced a decisive breakout above the upper channel boundary. The breakout occurred after a higher low formation near ₹30–35, suggesting accumulation at lower levels. This is typically an early-stage trend reversal pattern. 2) Breakout Zone Major Breakout Level ₹40–45 (upper channel resistance) The stock is now trading around ₹76.7, significantly above the breakout zone. This indicates: Breakout is already confirmed. Momentum buyers have entered aggressively. Previous resistance should now act as support. 4) Momentum Assessment Strong Bullish Signals ✅ Clean breakout from a multi-year falling channel. ✅ Sharp price expansion after breakout. ✅ Strong bullish weekly candle (+13%). ✅ Trend reversal structure visible. ✅ Breakout accompanied by increasing momentum. Trading View Pattern: Multi-Year Falling Channel Breakout Breakout Zone: ₹40–45 Immediate Support: ₹68–72 Major Support: ₹60–65 Targets: ₹85 → ₹100 → ₹115 → ₹130+ Invalidation: Below ₹45