22nd May · SEBI-Registered Analyst
Currency Grow (CA & SEBI Reg IA Omkar Bhutada) · 22nd May
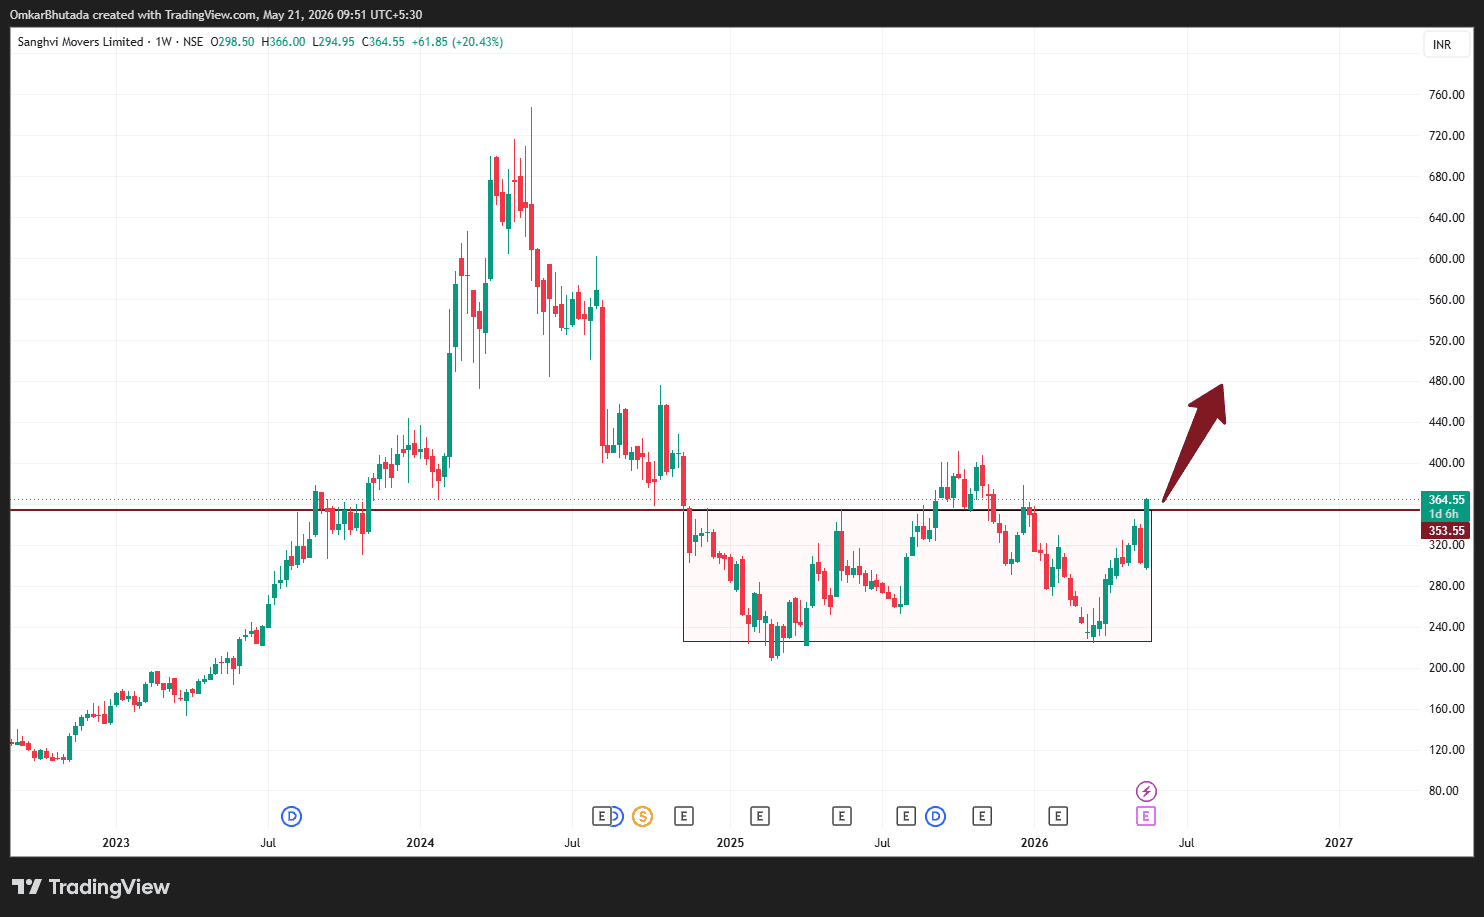
current Sanghvi Movers weekly chart:
$SANGHVIMOV What the chart is saying: Price has spent months inside a broad accumulation/range zone (~₹220–₹355). Current candle has given a powerful breakout above ₹353–355 resistance. Weekly candle is huge (+20% move) — buyers entered aggressively. Price is breaking out after a long base, and long consolidations often create larger directional moves. The breakout is happening from a higher low structure, which adds strength. Key levels: Immediate breakout zone: ₹350–355 Retest support: ₹330–340 Range low: ₹220–230 Current chart interpretation: Above ₹355, this remains bullish. The old resistance around ₹355 can now act as new support. If price sustains on weekly closing basis, next move can expand quickly because there is relatively less supply overhead. Projected zones from this structure: First zone: ₹420–450 Next zone: ₹480–520 The important part: this chart is not in a random spike phase. It is showing a base breakout after long consolidation, which is generally a higher-quality move than vertical momentum stocks.