20th May · SEBI-Registered Analyst
Currency Grow (CA & SEBI Reg IA Omkar Bhutada) · 20th May
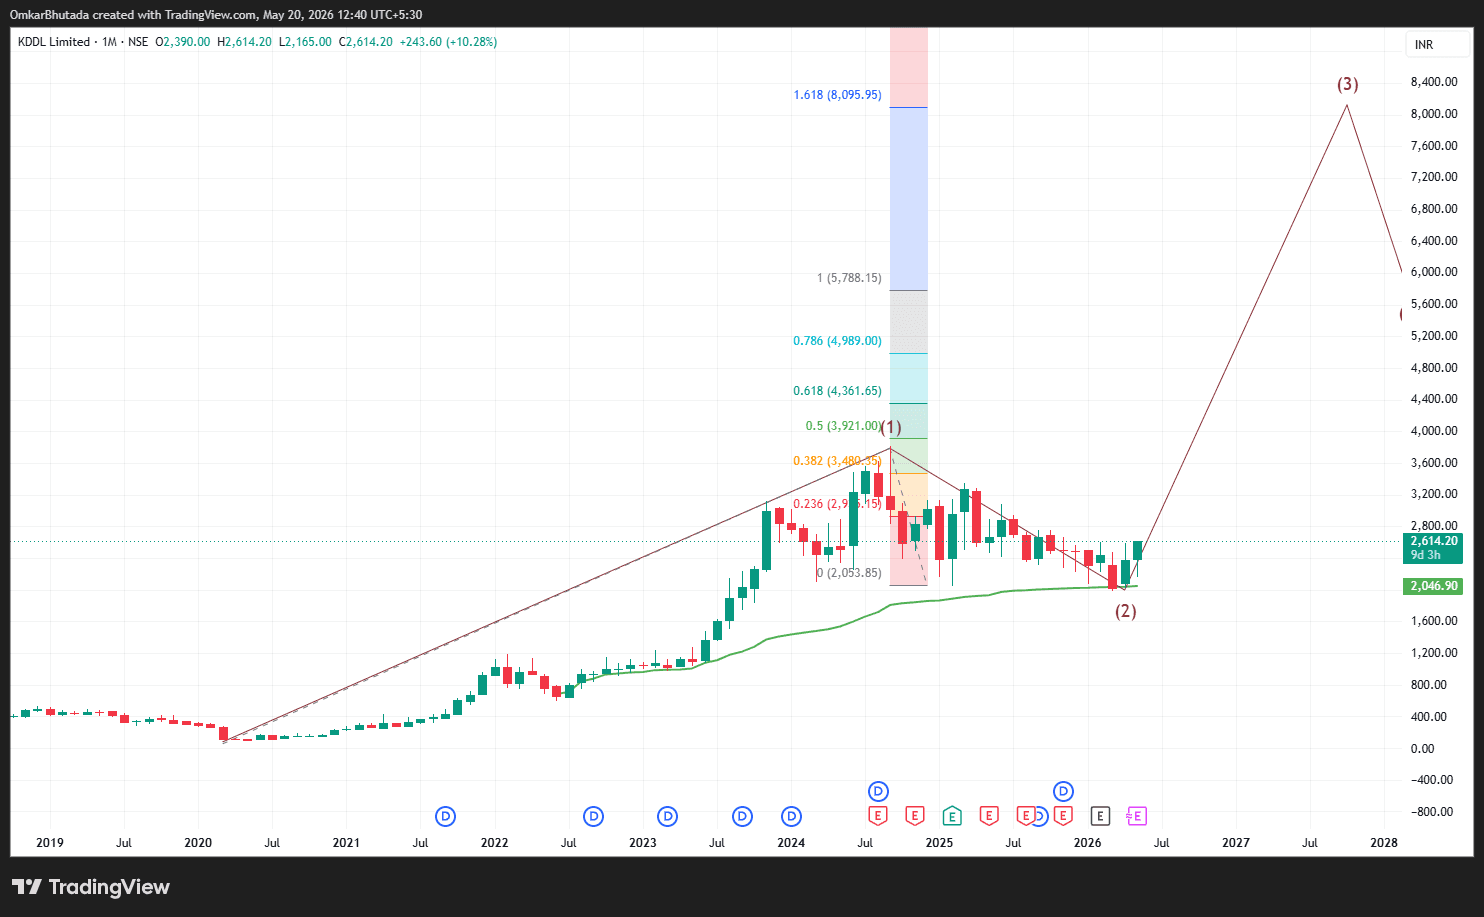
Elliott Wave + Fibonacci Confluence on a Fundamentally Strong Stock!
$KDDL The monthly chart is displaying a compelling Elliott Wave setup with Fibonacci extension alignment, where the stock appears to have completed a corrective Wave-(2) phase near a strong support zone and is now attempting to begin a fresh impulsive cycle. Price action around the ₹2,050–₹2,100 zone has acted as an important demand area, increasing the probability of trend continuation. From an Elliott Wave perspective, the structure suggests that Wave-(1) has already completed, followed by a healthy Wave-(2) correction. The current recovery phase could mark the beginning of Wave-(3) — typically the strongest and longest phase in Elliott Wave theory. The projected upside aligns with Fibonacci extension zones, creating a potential long-term expansion structure. The momentum profile also hints at a bullish MACD divergence, where downside price movement started weakening while momentum gradually stabilized during the correction phase. Such divergence often becomes an early signal of trend exhaustion before stronger upward moves emerge. Price is also holding above a key AVWAP support zone, which now acts as an important institutional reference level. Sustaining above this area generally indicates stronger accumulation and improved trend quality. The fundamental picture further strengthens the setup: ✔ Strong ROCE and efficient capital allocation ✔ Consistent earnings growth with improving business performance ✔ Specialized business model with long-term growth visibility and scalability When Elliott Wave structure, Fibonacci confluence, MACD confirmation, AVWAP support, and quality fundamentals align together, they often create powerful high-probability opportunities. If momentum sustains, the developing Wave-(3) structure could become the next major trend-driving phase.