10th Jun · SEBI-Registered Analyst
Currency Grow (CA & SEBI Reg IA Omkar Bhutada) · 10th Jun
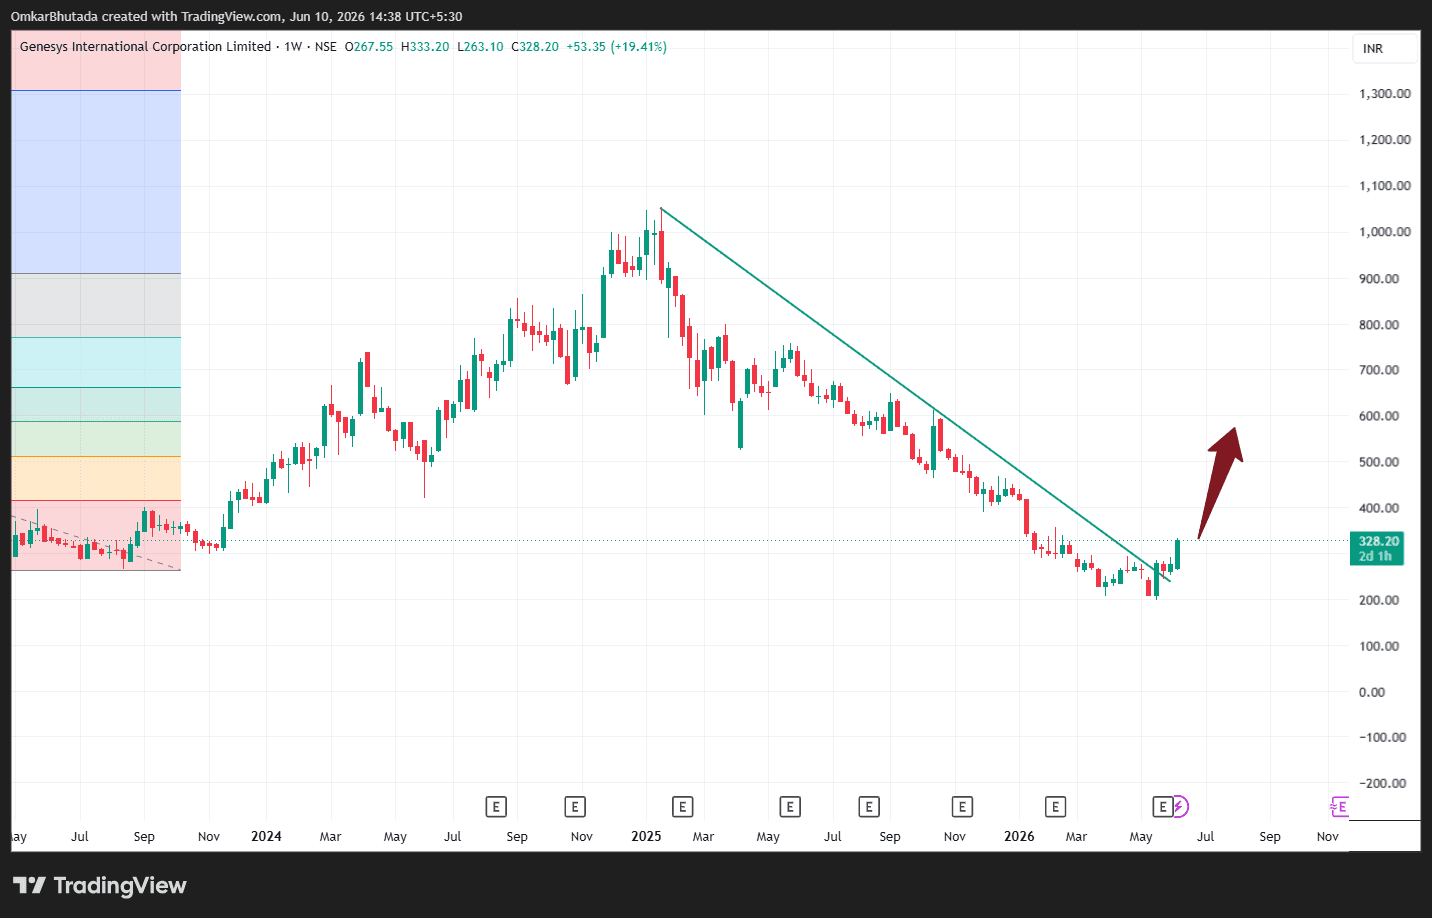
GENESYS INTERNATIONAL (Weekly Chart Analysis)
$GENESYS Pattern Identification Major Downtrend Line Breakout Stock corrected from around ₹1,000 to ₹220 over nearly 18 months. A clear descending trendline connected all major swing highs. Current weekly candle has delivered a strong breakout above the falling trendline, indicating a potential trend reversal. Breakout Zone Trendline breakout area: ₹300–320 Current price: ₹328 First decisive weekly close above the trendline is visible. Measured Move Target The prior downtrend channel width suggests: Targets: T1: ₹400 T2: ₹500 T3: ₹600+ These align with previous supply zones visible during the decline. Momentum Assessment ✅ Breakout from a long-term falling trendline ✅ Strong weekly candle (+19%) ✅ Breakout occurring near multi-year lows after prolonged correction ✅ Potential change of character from lower-high/lower-low structure ⚠️ Volume confirmation would strengthen conviction further. Entry / Retest Zone Aggressive Entry ₹320–335 Ideal Retest Entry ₹300–315 (trendline retest) A successful retest of the broken trendline would provide a lower-risk setup.