10th Jun · SEBI-Registered Analyst
Currency Grow (CA & SEBI Reg IA Omkar Bhutada) · 10th Jun
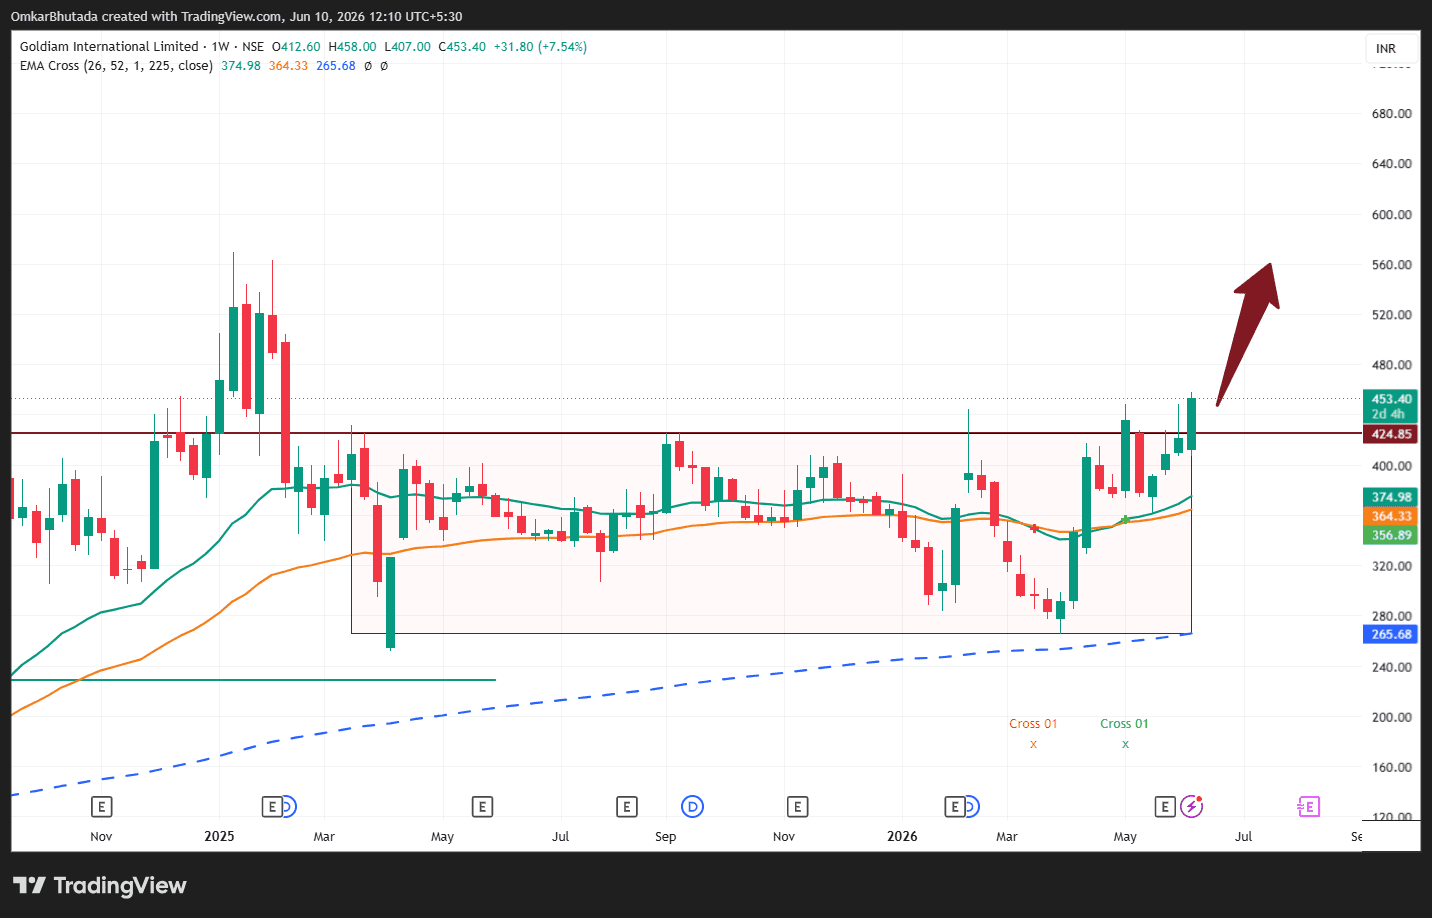
GOLDIAM INTERNATIONAL (Weekly Chart Analysis)
$GOLDIAM Pattern Identification Large Rectangle Consolidation Breakout Stock spent almost 15 months consolidating between ₹270–425. Current weekly candle has closed decisively above the ₹425 resistance zone, confirming a fresh breakout. Breakout is supported by price trading above the 26 EMA, 52 EMA and 225 EMA, indicating strong trend alignment. Breakout Zone Major resistance turned support: ₹425–430 Current price: ₹453 Weekly close above ₹425 is the key confirmation. Measured Move Target Rectangle Height: Resistance = ₹425 Support = ₹270 Height = ₹155 Measured Move: ₹425 + ₹155 = ₹580 target Targets: T1: ₹500–520 T2: ₹580 (classical measured move) T3: ₹650+ if momentum expands and market remains supportive