3rd Jun · SEBI-Registered Analyst
Currency Grow (CA & SEBI Reg IA Omkar Bhutada) · 3rd Jun
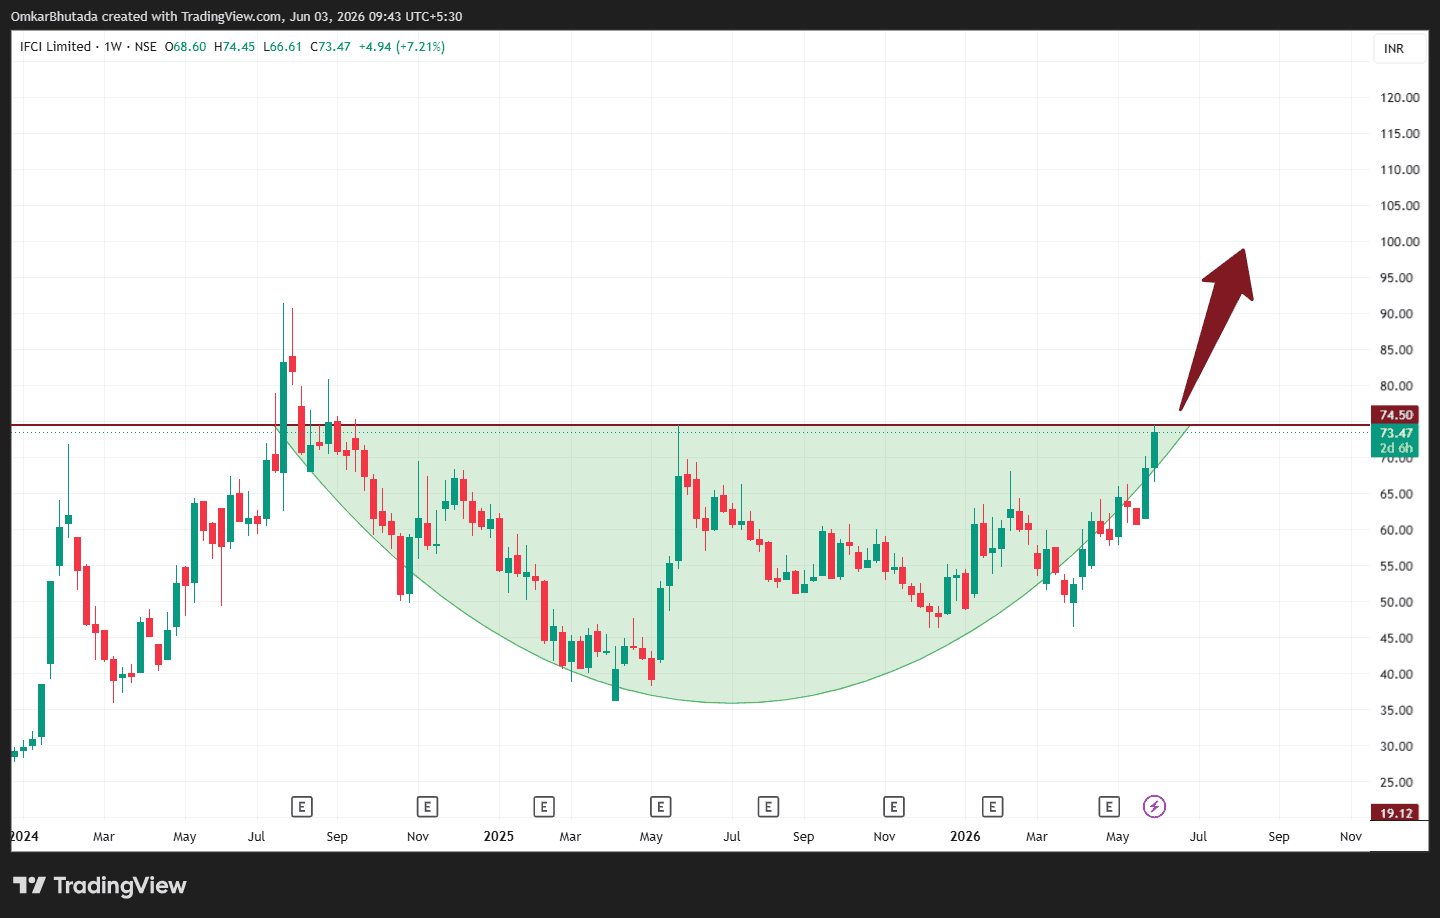
IFCI Ltd. (Weekly Chart) – Technical Analysis
$IFCI 1) Pattern Identification The stock appears to be forming a large Cup & Handle pattern on the weekly timeframe. The left rim was created near ₹74-75 during 2024. After a long rounded base formation, price has returned to the same resistance zone. The recent rise from the ₹48–50 area has formed the right side of the cup. 2) Breakout Zone Immediate breakout level: ₹74.50 – ₹75 Current weekly close: approximately ₹73.47 The stock is trading just below the neckline and is attempting a breakout. A strong weekly close above ₹75 with volume expansion would confirm the pattern. 3) Measured Move Targets Cup depth approximately: Neckline: ₹75 Cup bottom: ₹38–40 Depth: ~₹35