‹ All Posts
CA Omkar Bhutada - SEBI Reg IA

19th Feb · SEBI-Registered Analyst

Mangalam Cement Ltd

MANGLMCEM
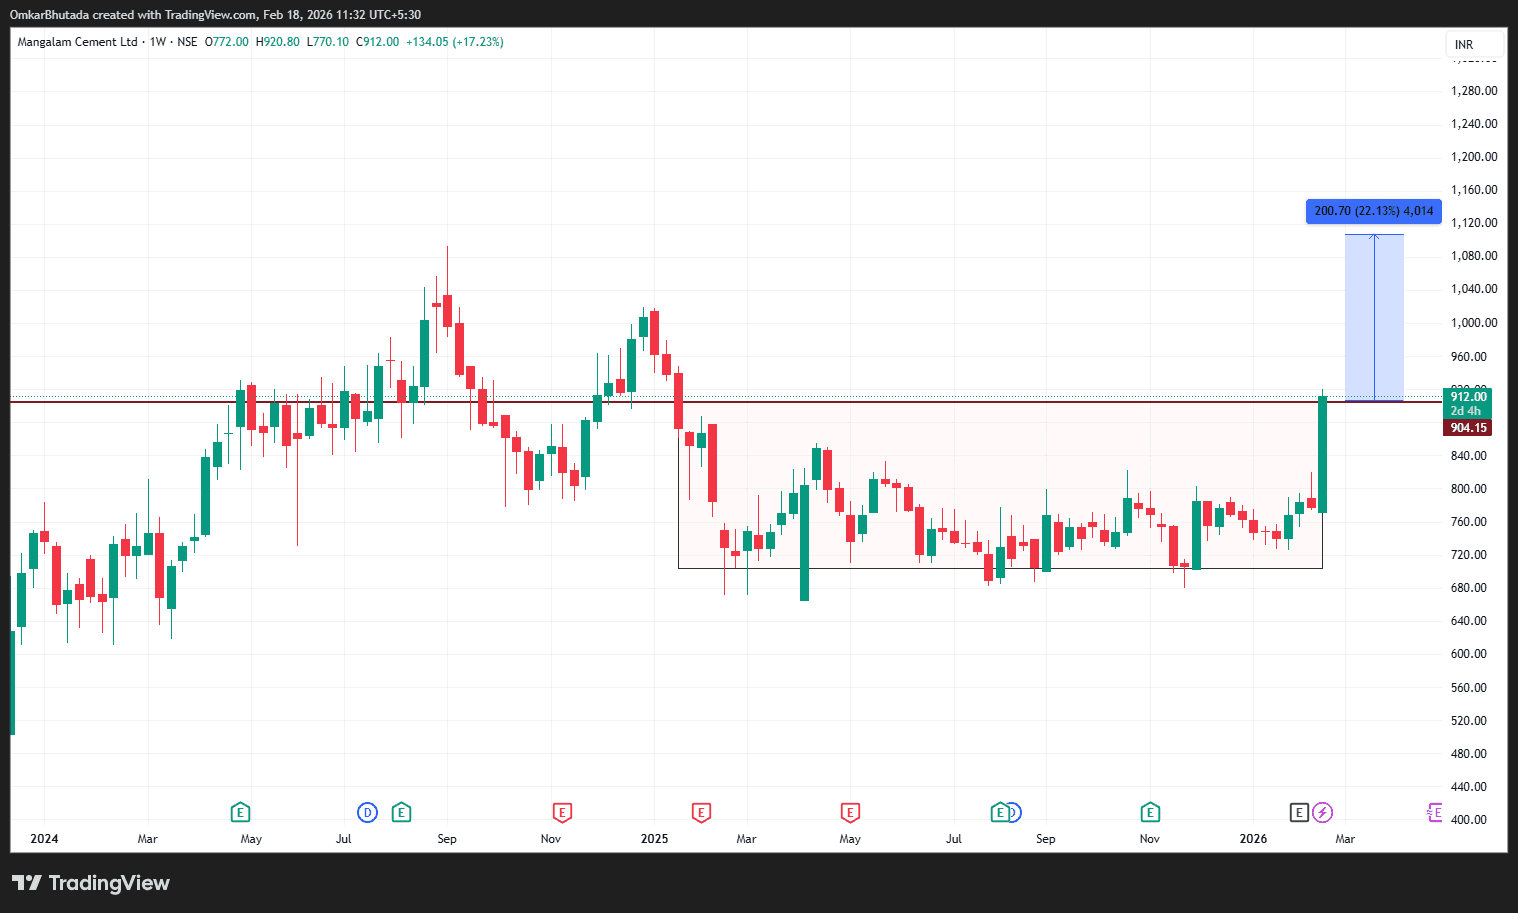
9-Month Base Breakout – Start of Expansion Phase? Timeframe: Weekly CMP: ₹912 Measured Move Projection: ₹1,100–1,120 (~20–22%) 🔹 Structure Overview – Rectangle Accumulation From March 2025 to Feb 2026, price was locked in a broad consolidation range: Support Zone: ₹700–720 Resistance Zone: ₹880–900 Time spent in base: ~9 months This is classic Wyckoff-style accumulation — prolonged sideways before markup. Now price has given a decisive weekly breakout above ₹900 with strong candle body. Time correction ✔ Volatility compression ✔ Range expansion ✔ This is structural shift. 🔹 Elliott Wave Perspective Probable structure: Wave 1: ₹600 → ₹1,050 Wave 2: Deep correction into ₹700 zone Wave 3: Sideways time correction (complex WXY pattern) Wave 4: Final shakeout near ₹720 Wave 5: Breakout phase starting now If Wave 5 unfolds impulsively: Measured target aligns near ₹1,100–1,150. Cement stocks typically give sharp markup once base resolves. 🔹 Momentum Context Observations: ✔ Wide range bullish candle ✔ Breakout above multi-month resistance ✔ No immediate upper shadow rejection ✔ Volume expansion visible This is not a retail breakout — looks institutional. 🔹 AVWAP / Value Logic Anchored from 2025 swing high (~₹1,050): Price has now reclaimed that anchored resistance Acceptance above ₹900 converts it into support As long as price holds above ₹850–870, structure remains bullish. 🔹 Risk Map Immediate Support: ₹880 Structural Support: ₹820 Failure Level: Weekly close below ₹780

#HiddenGems#FundamentalViews#TechnicalViews#StockInNews#Today’sTradingSetup
MANGLMCEM_2026-02-18_11-32-57.png
896 likes·43 comments