25th Jun · SEBI-Registered Analyst
Currency Grow (CA & SEBI Reg IA Omkar Bhutada) · 25th Jun
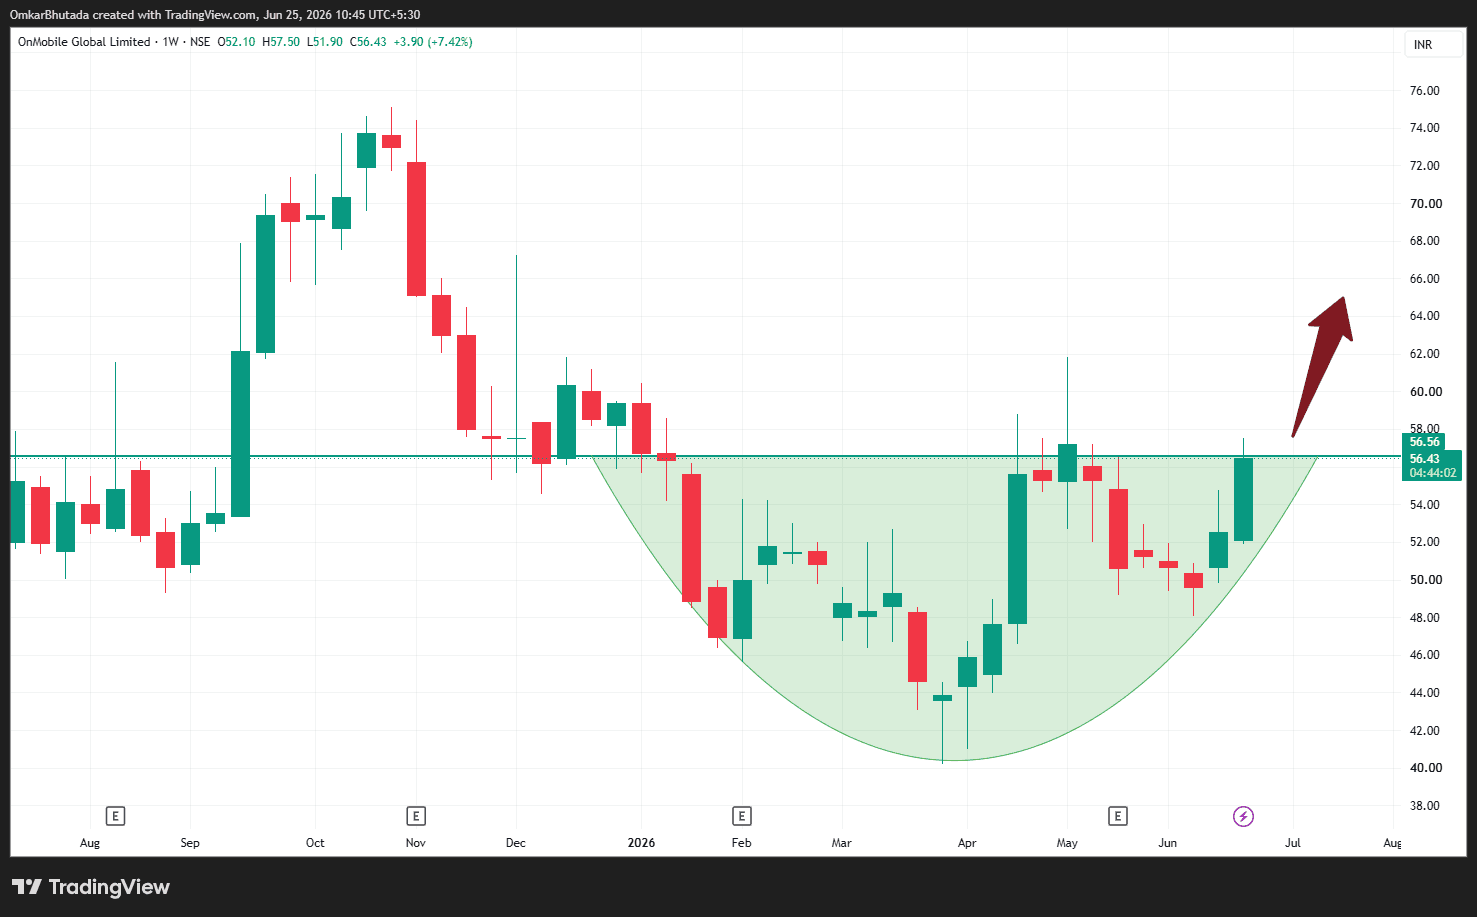
OnMobile Global (Weekly Chart Analysis)
$ONMOBILE What the Chart is Showing ✅ Rounded Bottom Formation Stock fell from ₹75 → ₹40. Created a long rounding base over several months. Price has now returned to the neckline zone around ₹56-57. This is the first sign of a trend reversal. ✅ Breakout Attempt Underway The green line around: ₹56-57 is the major resistance. Current candle is testing that exact level. A weekly close above ₹57 would confirm the breakout. ✅ Momentum Returning The recent candles show: Higher lows Strong bullish candles Increasing buying interest This suggests accumulation rather than random volatility. What I Don't Like ❌ Significant Overhead Supply Look at the left side of the chart. Many investors bought between: ₹60 ₹65 ₹70 ₹75 As price approaches these zones, trapped investors may sell.