4th Jun · SEBI-Registered Analyst
Currency Grow (CA & SEBI Reg IA Omkar Bhutada) · 4th Jun
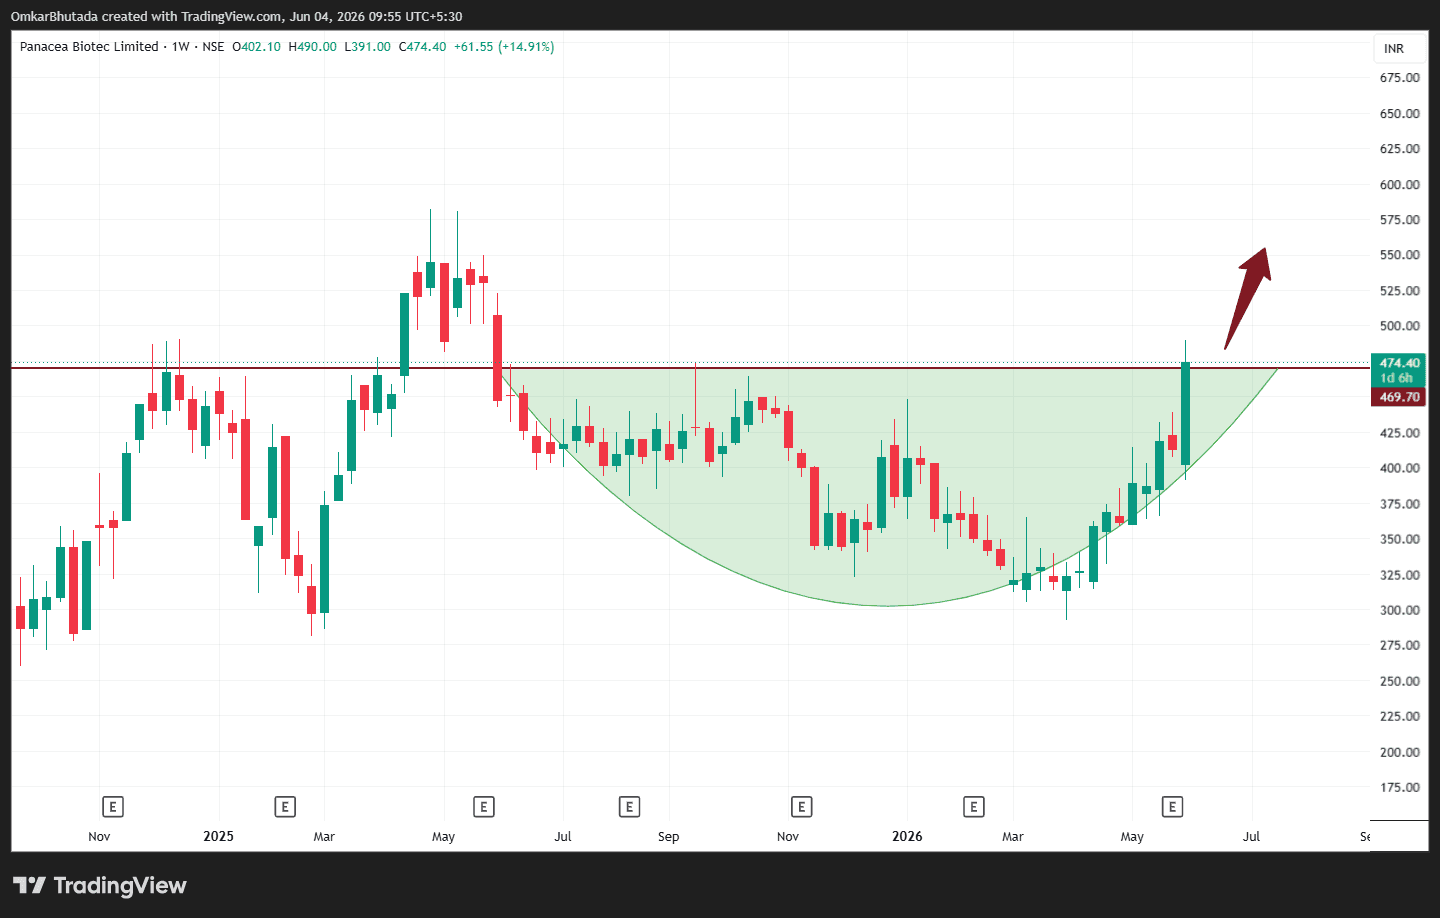
Panacea Biotec (Weekly Chart) – Technical Analysis
$PANACEABIO 1. Pattern Identification The stock has formed a large Cup & Handle breakout pattern on the weekly timeframe. The cup spans from the 2025 highs around ₹470–480, followed by a prolonged correction and rounded recovery. The recent consolidation around ₹320–430 acted as the handle. This week price has delivered a strong breakout candle above the neckline. This is one of the more reliable bullish continuation/reversal patterns when it appears after a long consolidation phase. 2. Entry / Retest Zones Aggressive Entry ₹460–480 Suitable while the stock remains above the breakout zone. Conservative Entry Wait for a pullback toward: ₹450–470 Neckline retest A successful retest of the breakout area would provide a lower-risk entry. 8. Probability View 1–3 months: Bullish 3–6 months: Strong Bullish 6–12 months: Potential move toward ₹600–700 if the breakout sustains