27th Jun · SEBI-Registered Analyst
Currency Grow (CA & SEBI Reg IA Omkar Bhutada) · 27th Jun
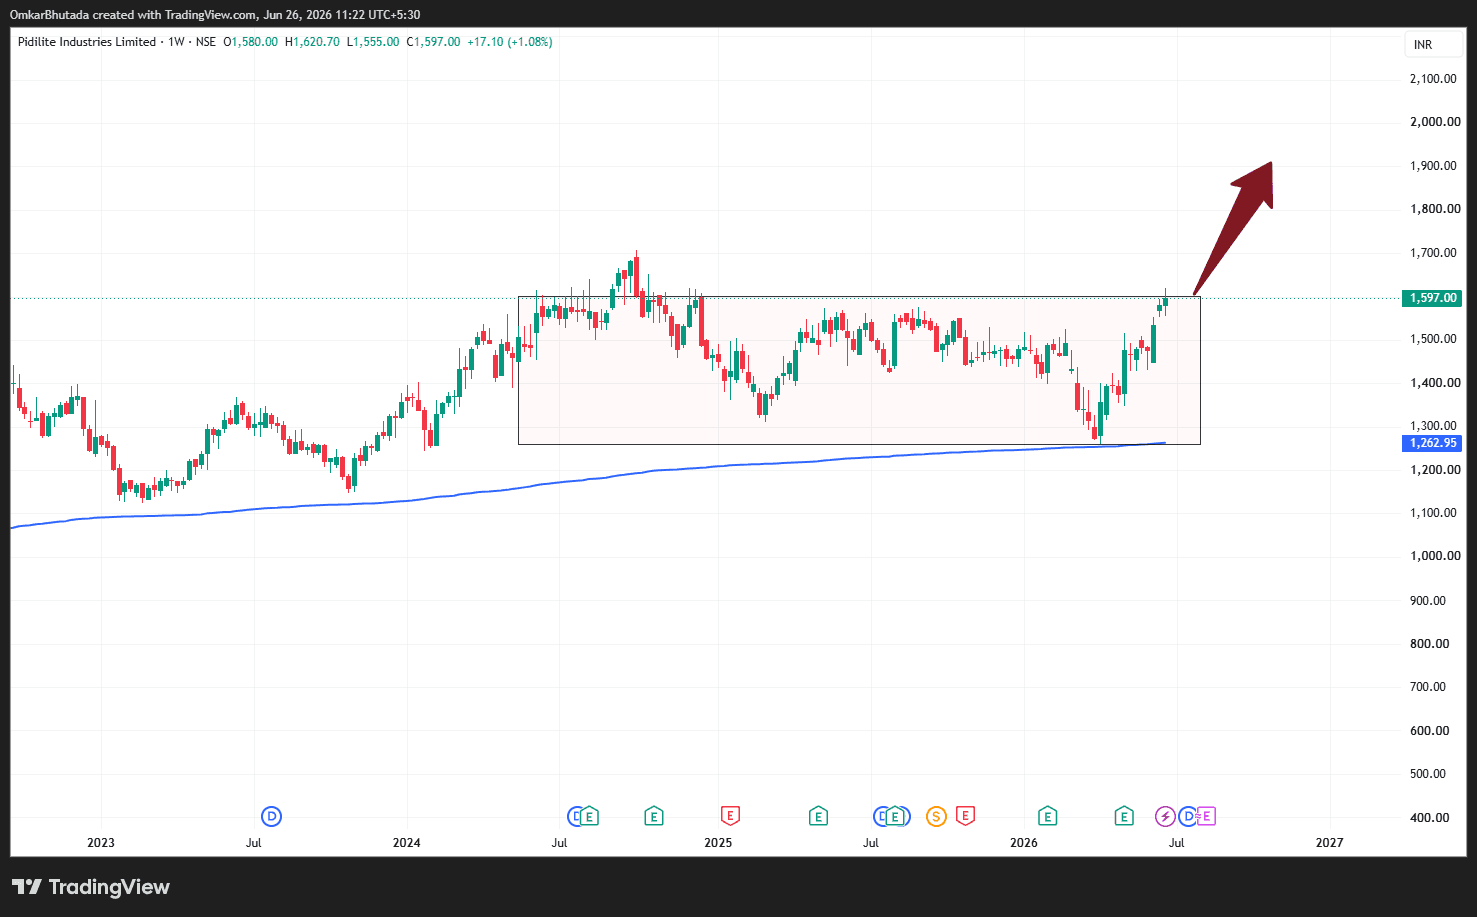
Pidilite Industries (Weekly Chart Analysis)
$PIDILITIND Pattern Analysis ✅ 1. Two-Year Rectangle Consolidation The stock has spent almost two years trading within a defined range: Support: ₹1,260–1,300 Resistance: ₹1,580–1,600 Long consolidations often store significant energy. A breakout after such a prolonged sideways move can lead to a sustained trend. ✅ 2. Breakout at All-Time Resistance The current weekly candle is pushing through the ₹1,580–1,600 resistance zone. This is an important technical event because price has been rejected from this area multiple times over the past two years. A weekly close above ₹1,600 would make the breakout much more convincing. ✅ 3. Strong Long-Term Trend Unlike many turnaround charts, Pidilite has: Rising long-term moving averages A history of making higher highs and higher lows over the long run Strong institutional ownership This suggests the broader uptrend remains intact. ✅ 4. Support from the 200-Week Moving Average The 200-week moving average is rising and sits well below the current price, reinforcing the long-term bullish structure. Price Targets Rectangle height: Resistance: ~₹1,600 Support: ~₹1,280 Height ≈ ₹320 Classical Target ₹1,600 + ₹320 = ₹1,920 Intermediate Targets Target 1: ₹1,700 Target 2: ₹1,800 Target 3: ₹1,900–1,950