29th Jun · SEBI-Registered Analyst
Currency Grow (CA & SEBI Reg IA Omkar Bhutada) · 29th Jun
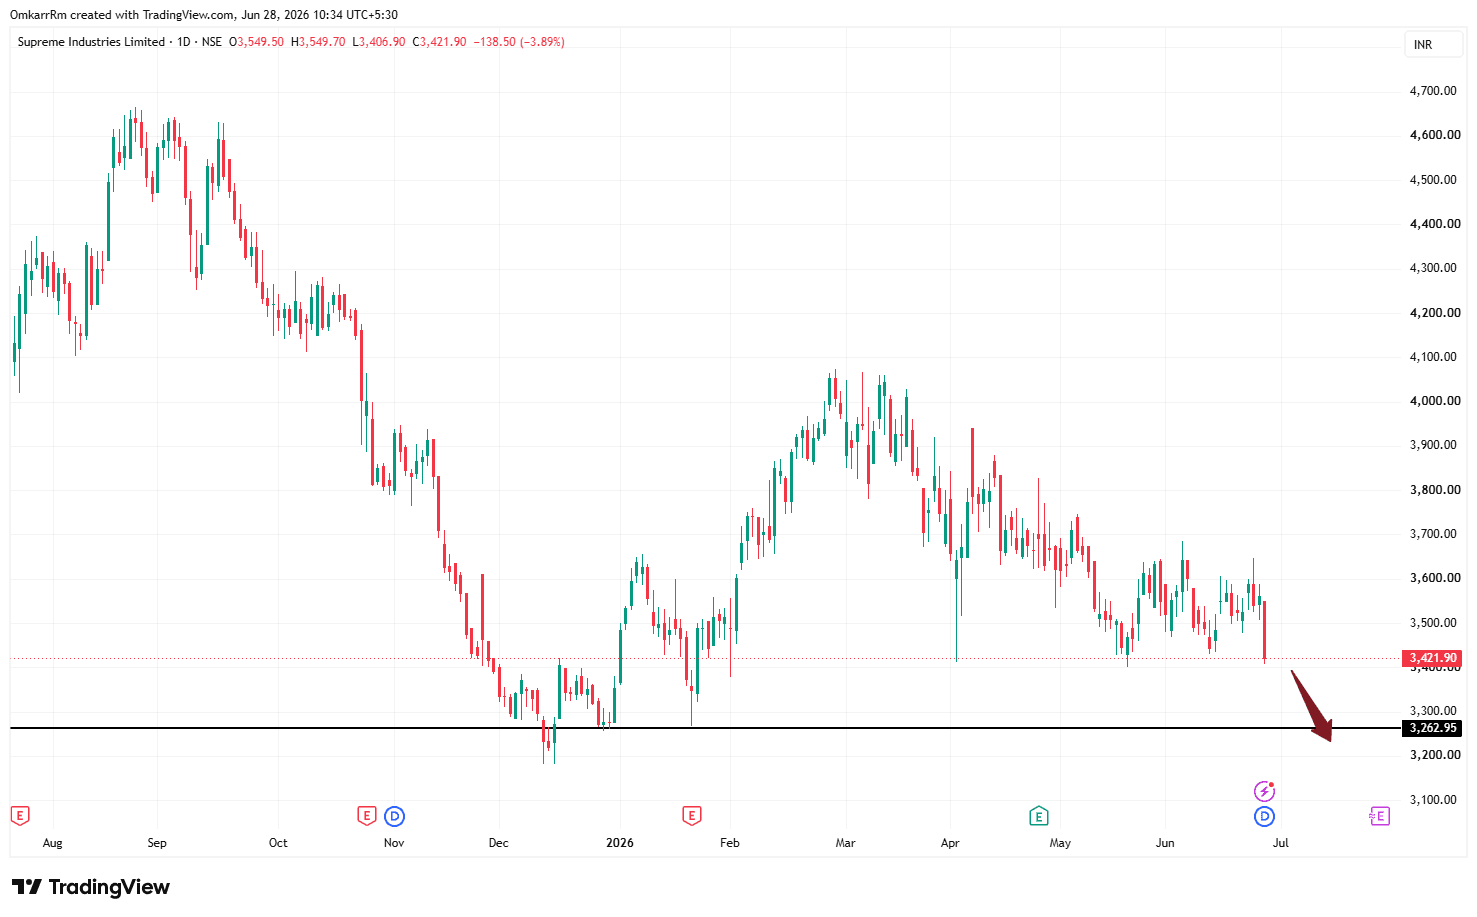
The stock is no longer just correcting—it is approaching a major multi-month support after a sequence of lower highs and lower lows.
$SUPREMEIND 1. Market Structure The trend has clearly deteriorated: Peak near ₹4,050 Lower high around ₹3,850 Lower high around ₹3,700 Lower high around ₹3,600 Meanwhile: Lower lows continue to form. Every bounce has been sold. This is classic distribution rather than accumulation. 2. Critical Support Zone The ₹3,260 level is extremely significant because: It acted as a major swing low in December. It acted as support again in January. It is now being tested for a third time. Support weakens with repeated tests because buyers who defended it previously may have already committed their capital. 3. Selling Momentum The most recent candle is noteworthy: Strong bearish body Closed near the low Broke below recent consolidation Little evidence of buying into weakness This suggests sellers remained in control through the session. 4. No Reversal Evidence Yet For a bullish reversal, you would typically want to see one or more of: Hammer Bullish engulfing Morning star Long lower shadow High-volume reversal None of those are visible yet. 5. If ₹3,260 Breaks The range between approximately ₹3,600 and ₹3,260 is about ₹340. Applying a measured move: Breakdown: ₹3,260 Minus range height: ₹340 Projected target: around ₹2,920 Intermediate supports lie near: ₹3,180 ₹3,080 ₹2,950