
‹ All Posts
CA Omkar Bhutada - SEBI Reg IA

22nd Feb · SEBI-Registered Analyst

Thejo Engineering Limited (Daily Chart)
THEJO
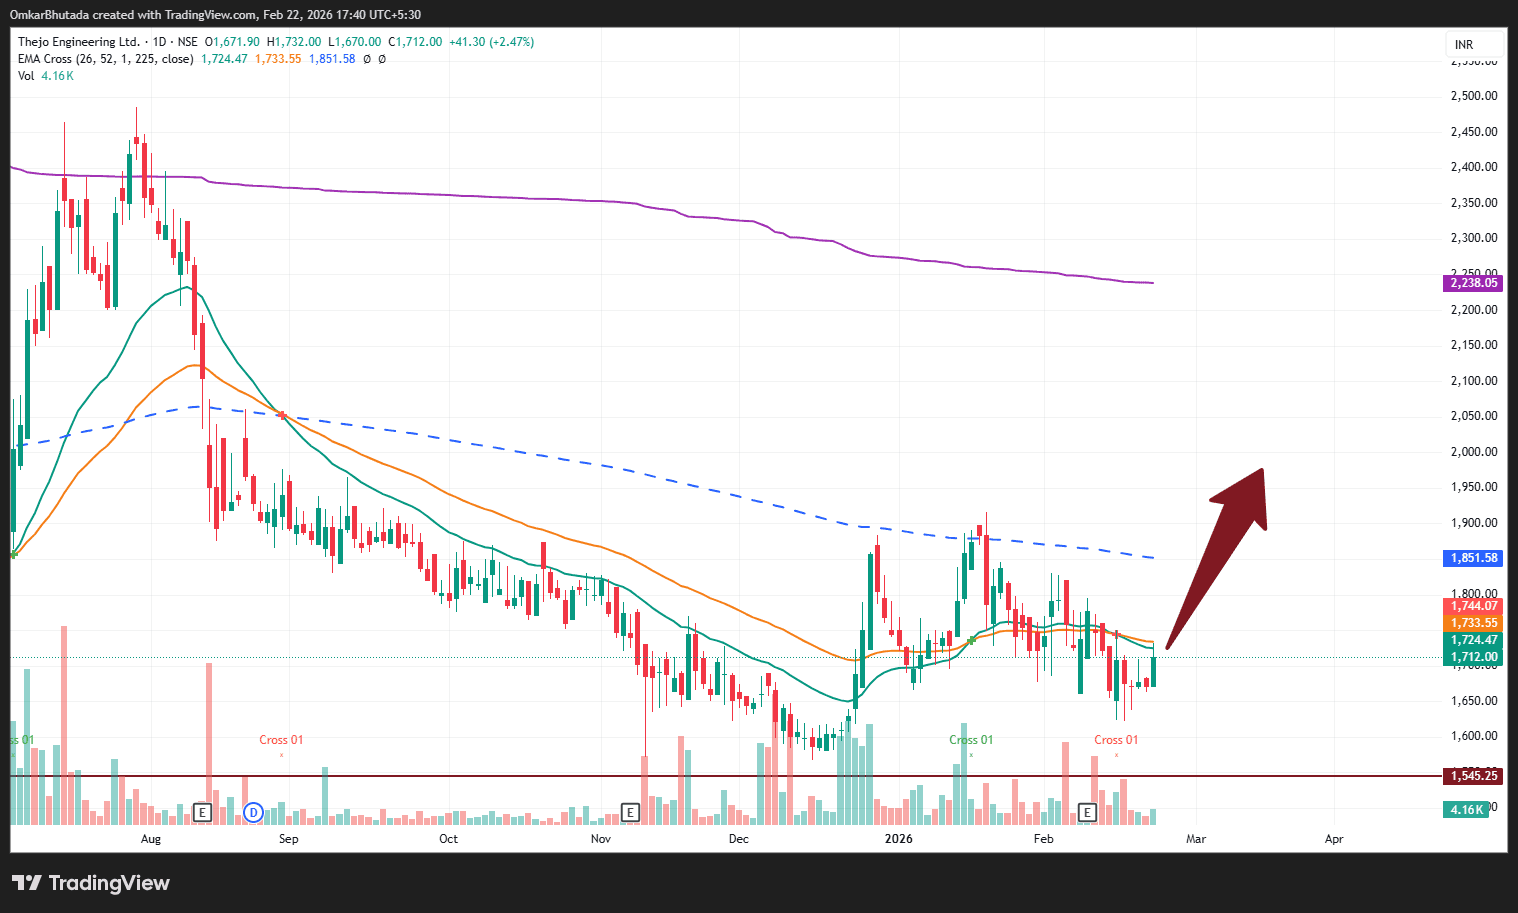
Downtrend Base Formation – Early Reversal Attempt? CMP: ₹1,712 Primary Trend: Bearish (Long-term) Short-term Structure: Base building 📉 Larger Trend Context Clear characteristics: • Persistent lower highs since ₹2,450 peak • Price below 225 EMA (~₹1,850) • 26 & 52 EMA below 225 EMA • Long-term trend still down This is still technically a counter-trend rally phase. 🧱 Current Structure However, short-term behaviour has improved: ✔ Strong bounce from ₹1,550 support ✔ Multiple higher lows forming ✔ Price consolidating above 26 & 52 EMA ✔ Volatility contraction near ₹1,700 This resembles Stage 1 accumulation. 🔑 Key Barrier: ₹1,850–₹1,900 (225 EMA Zone) That dashed blue 225 EMA is critical. This zone has: • Dynamic resistance • Prior supply • Trend control Break and sustain above ₹1,900 → structural shift possible. Until then → range-bound recovery. 📊 Volume Insight Recent bounce from ₹1,550 came with expansion in volume. But follow-through volume is moderate. Needs breakout volume above ₹1,850 for confirmation. 🎯 Scenarios Bullish Case Daily close above ₹1,900 → Target ₹2,050 → Then ₹2,200 This would mark medium-term reversal attempt. Bearish Case Failure near ₹1,800 Break below ₹1,650 → Retest ₹1,550 → Possibly new lows 🧠 Structure Summary Right now this is: Base → not breakout yet. Early accumulation → not confirmed trend reversal. Aggressive traders: Trade breakout above ₹1,850. Conservative: Wait for weekly close above 225 EMA. 📌 Professional View This is a potential reversal candidate, but not yet a confirmed uptrend. Risk–reward improves only above ₹1,850.

#StockInNews#WatchOutFor#Today’sTradingSetup#TechnicalViews#FundamentalViews
THEJO_2026-02-22_17-40-36.png
796 likes·82 comments