22nd May · SEBI-Registered Analyst
Currency Grow (CA & SEBI Reg IA Omkar Bhutada) · 22nd May
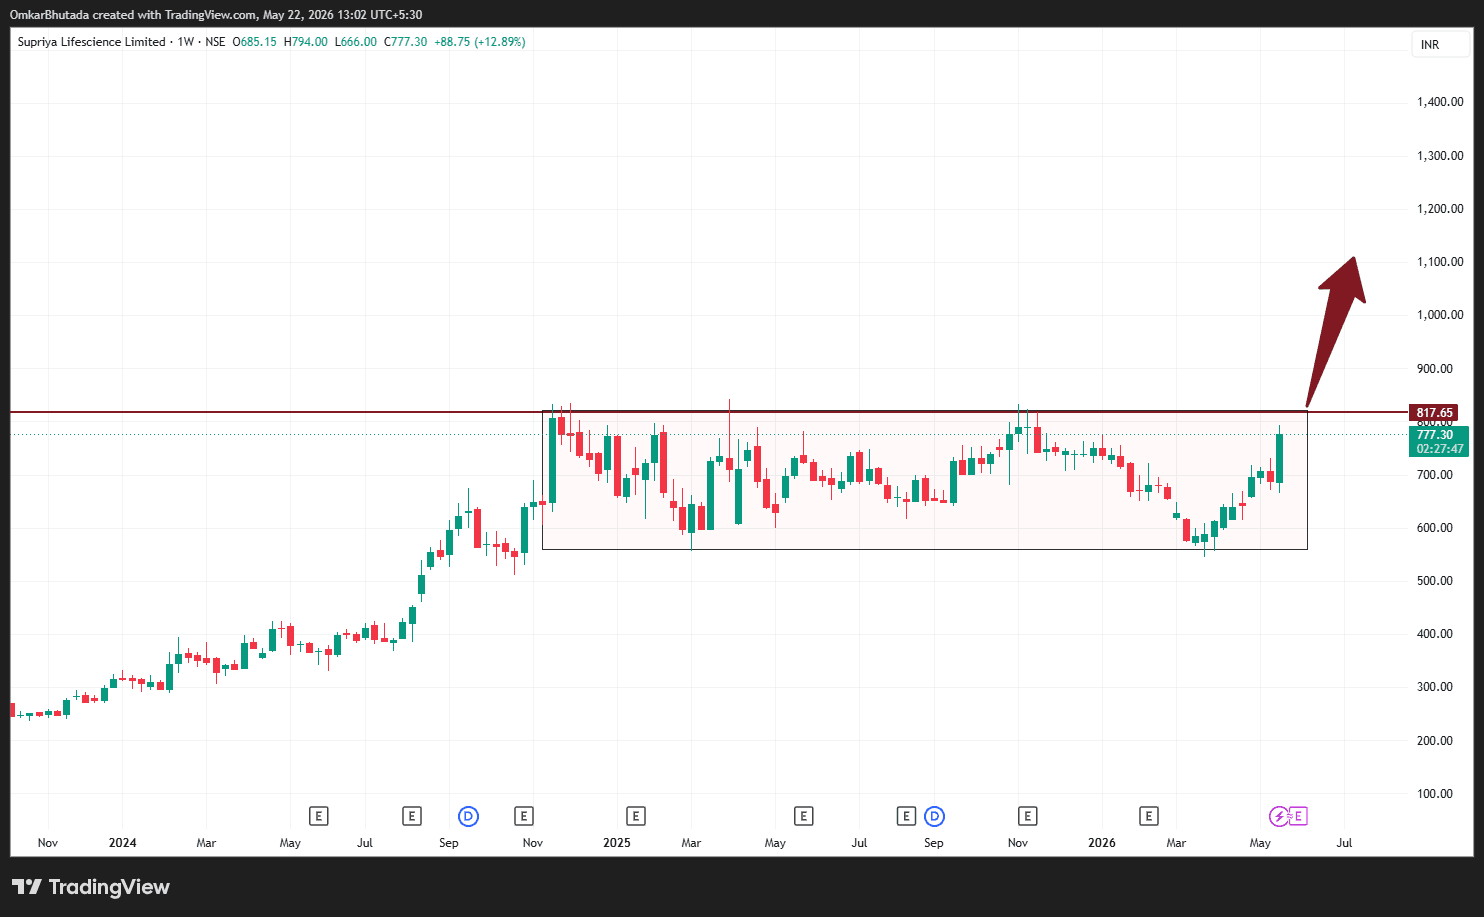
This weekly structure in Supriya looks technically interesting. Looking at your marked range:
$SUPRIYA What I see: Long consolidation box between roughly ₹570–₹820 Multiple failed attempts near ₹817–820 resistance Recent strong impulsive candles from the lower zone (~₹580–600) Price now at ₹777, approaching the top of the range Momentum expansion is stronger than prior swings This is essentially a range accumulation → breakout attempt setup. Your arrow toward ₹1,050–1,100 is reasonable only if the weekly close sustains above ₹820. Probable path: Immediate resistance: ₹817–₹830 Weekly close above this → breakout confirmation Retest zone: ₹800–820 Then move toward: ₹900 ₹980 ₹1,050–1,100 The move projection comes from measuring the range height: Range ≈ 820 − 570 = ~250 points Breakout target: 820 + 250 ≈ ₹1,070 That aligns closely with your arrow. The bigger insight: price is not breaking out after a vertical rally; it's breaking out after 18–20 months of sideways compression, and such bases often create strong trend legs. Risk area: Rejection around ₹820 with a weekly bearish candle Drop back below ₹730 can trap breakout buyers Among the charts you've shared (Arvind, Zydus, Raymond, Dredging, Sanghvi Movers, Supriya, etc.), Supriya currently sits in the category of "early-stage breakout candidate" rather than already extended momentum. This is the type of structure many positional traders prefer because risk can be defined tightly around the range.