28th Jun · SEBI-Registered Analyst
Currency Grow (CA & SEBI Reg IA Omkar Bhutada) · 28th Jun
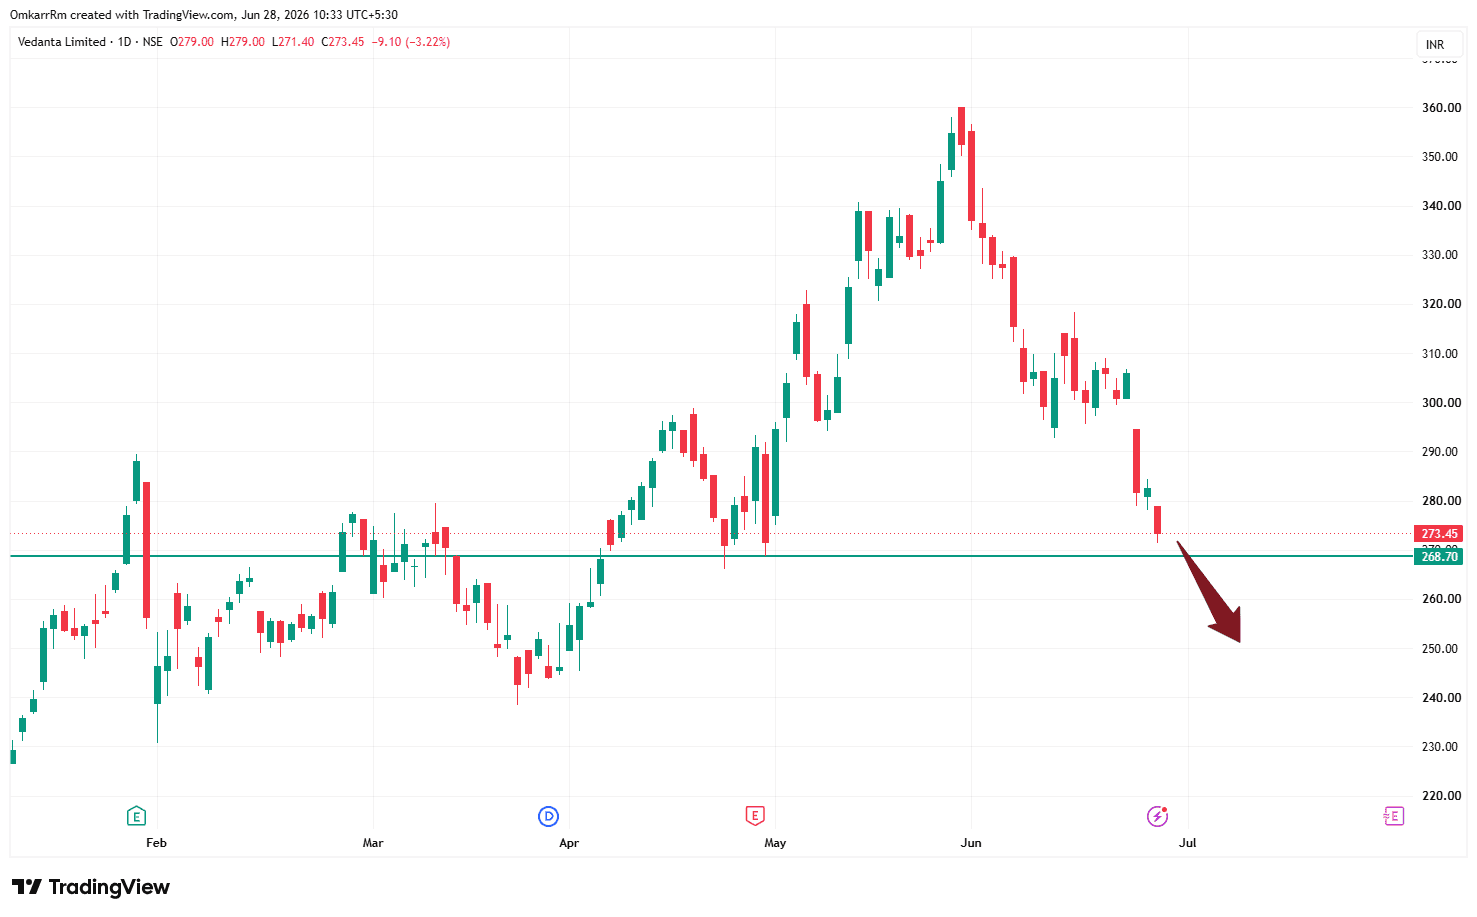
Vedanta has already shown several signs of weakness, and the path of least resistance is currently downward
$VEDL 1. Trend Has Already Changed Unlike Fortis, Vedanta's market structure has deteriorated. You can clearly see: ✅ Lower High (₹360) ✅ Sharp decline ✅ Lower High again (around ₹315) ✅ Another Lower High (around ₹305) The stock is now making lower highs, which is the first sign of a bearish trend. 2. Important Support is Breaking The green horizontal line around ₹268–270 has acted as support multiple times. Now price has: broken below it, and closed under it. A former support often becomes resistance after a breakdown. 3. Momentum is Weak Notice the character of the candles: Rally candles are relatively small. Selling candles are much larger and more decisive. That tells you sellers are currently in control. 4. No Strong Buying Reversal Yet A good reversal usually shows: Hammer Bullish engulfing Strong bullish breakout candle High-volume accumulation None of those are evident from this screenshot.