‹ All Posts
Dhwani Patel

1 hour ago · SEBI Registration INH200008608

Amber slips below key averages; ₹6,000 is crucial

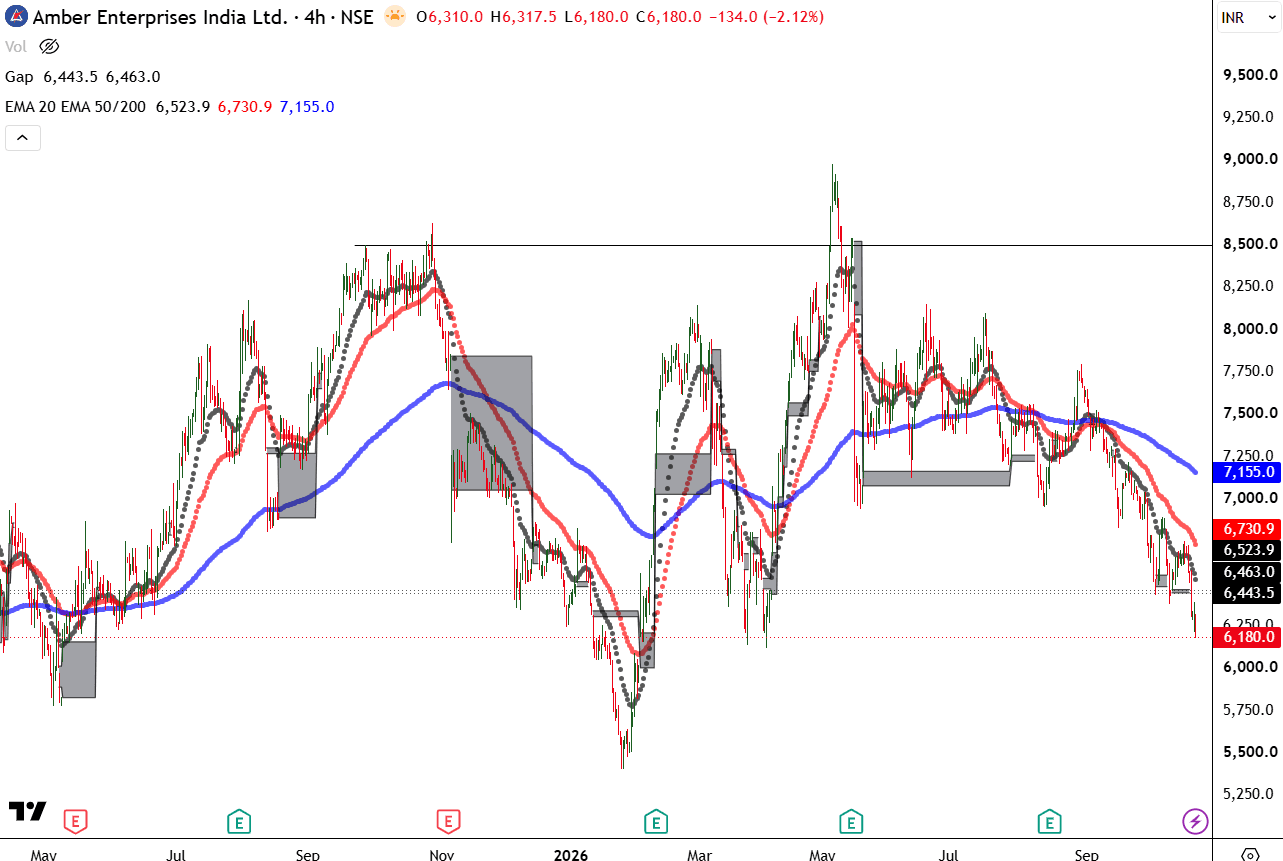
Amber Enterprises closed near ₹6,180 on the 4-hour chart, extending its recent decline and trading below the 20 EMA at ₹6,523.9, 50 EMA at ₹6,730.9, and 200 EMA at ₹7,155. The alignment is clearly weak: price is below all three averages, while the short-term averages are also below the long-term average. This shows sellers remain in control across multiple timeframes.
AMBER
The ₹6,150–₹6,000 region is the immediate demand zone. The chart has seen buyers emerge near this area earlier, making it an important level to defend. A sustained break below ₹6,000 would weaken the structure further and could open room toward the previous lower support near ₹5,750–₹5,800. On the upside, ₹6,440 is the first recovery level, followed by the 20 EMA near ₹6,524. A close above this moving average would indicate that selling pressure is easing. However, a stronger reversal would require the stock to reclaim ₹6,730 and eventually move back above the 200 EMA. Amber is exposed to consumer-electronics manufacturing and the seasonal demand cycle, but the present chart requires patience. Until price forms a higher low and moves above the 20 EMA, rallies may remain vulnerable to selling. The key setup is simple: watch whether ₹6,000 holds, and whether the price can reclaim ₹6,524 with strength.

#TrendingSectors#TechnicalViews#StockInNews
AMBER_Key_Support_Analysis.png.png
19 likes·19 comments