‹ All Posts
Dhwani Patel

6 mins ago · SEBI Registration INH200008608

Atul trades below all averages as recovery stalls
ATUL
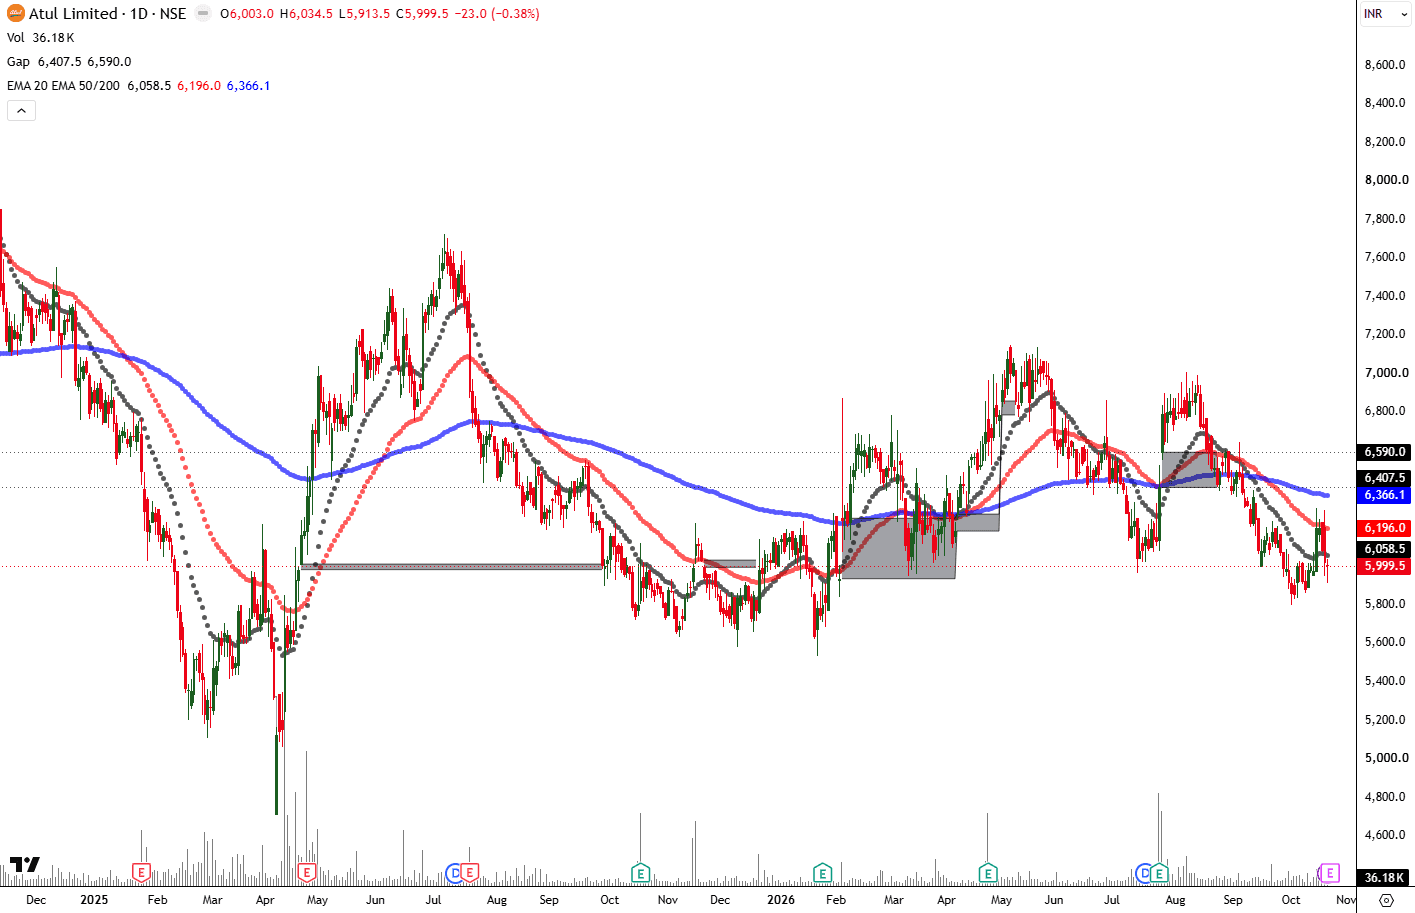
closed near ₹5,999.50 and remains under pressure after failing to hold the recent rebound. The price is now below the 20-day EMA at ₹6,058.5, the 50-day EMA near ₹6,196, and the 200-day EMA around ₹6,366.1. This stacked moving-average structure is bearish because each recovery faces progressively stronger resistance overhead. Atul Ltd - The ₹5,900–₹6,000 zone is the immediate support area. It has attracted buying interest on earlier declines, so a sustained hold here could allow the stock to stabilise. However, a break below ₹5,900 would weaken the structure further and may expose the ₹5,800 region. The earlier bases visible on the chart show why these levels matter: they represent areas where demand previously emerged after sharp corrections. For a technical recovery, Atul first needs to reclaim ₹6,058. A move above ₹6,196 would improve short-term sentiment, while the 200-day EMA near ₹6,366 remains the larger trend-reversal hurdle. Until these averages are recovered, any bounce should be considered a repair attempt rather than a confirmed uptrend. Atul’s specialty-chemicals business gives it long-term relevance in industrial and agricultural value chains, but the chart currently reflects cautious market positioning. The key observation is whether ₹5,900 holds and buyers can push price back above the 20-day EMA. Failure to do so keeps the stock vulnerable to another leg lower.

#WatchOutFor#StockInNews#TechnicalViews#SectorBreakouts
ATUL_Moving_Average_Resistance_Analysis.png.png
1 comment