When a Doji candlestick forms near the top of a chart
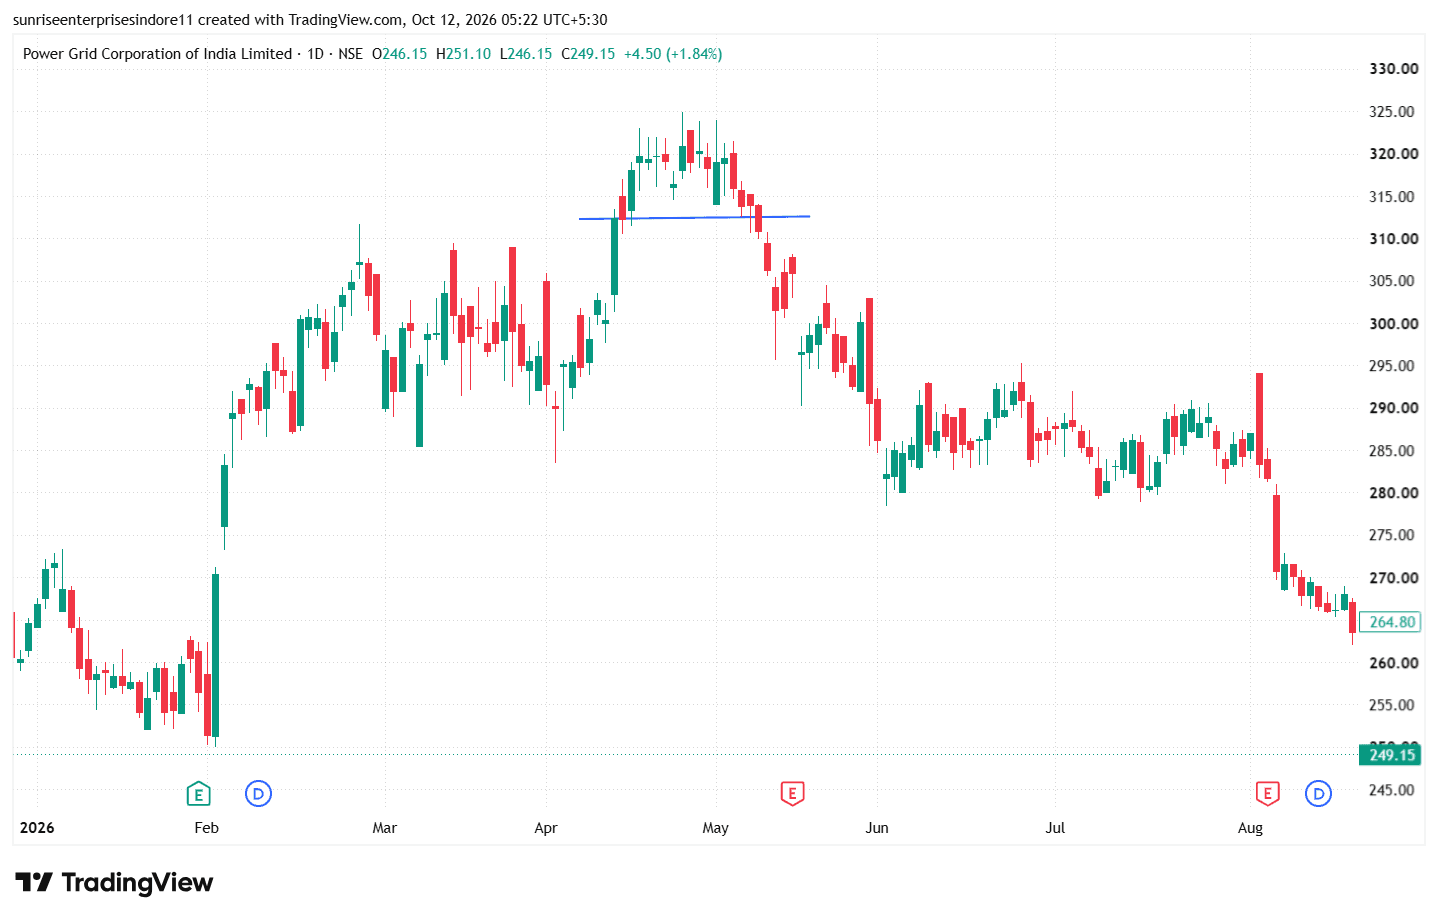
POWERGRID
When a Doji candlestick forms near the top of a chart, followed by consolidation and an eventual trend reversal, it may indicate weakening bullish momentum and a possible shift in market sentiment. A Doji forms when the opening and closing prices are nearly equal, reflecting indecision between buyers and sellers after an upward move. If the price then consolidates near the top and repeatedly fails to make fresh highs, it suggests that buying pressure may be fading and sellers could be gradually gaining control. A decisive breakdown below the consolidation range or a key trendline support zone, especially with a strong bearish candle and increasing volume, can provide confirmation of a potential bearish reversal. If the price subsequently starts forming lower highs and lower lows, it further strengthens the possibility of a developing downtrend. However, a Doji alone does not confirm a reversal; traders should wait for a confirmed breakdown and follow-through selling before interpreting the price action as a trend change.
Technical Analysis | Educational Purpose Only | Not Investment Advice.