
‹ All Posts
Rajneesh Sharma CFTe

6th Oct · SEBI-Registered Analyst

🍬 Bannari Amman Sugars Ltd. – Breakdown from Support Trendline
BANARISUG
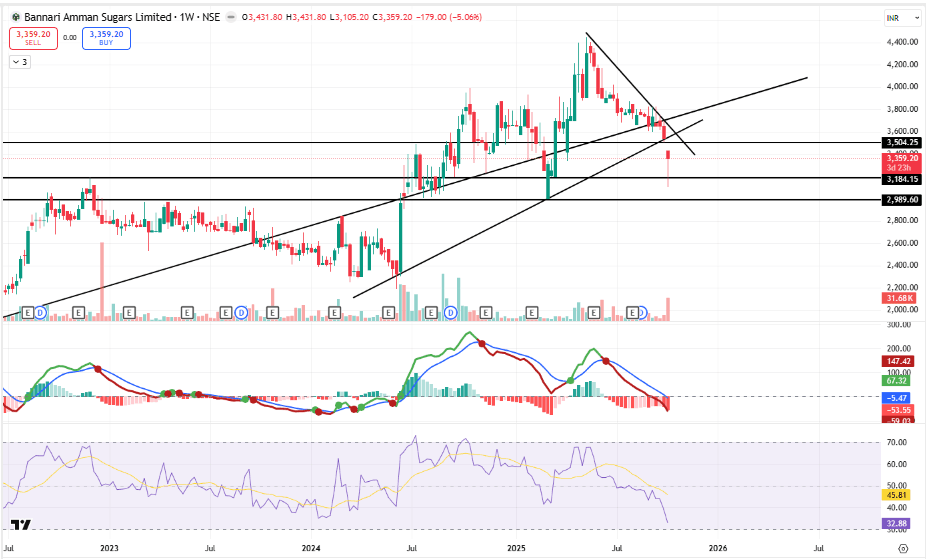
🔹 Price Action CMP: ₹3,359.20 (▼5.06%) The stock has broken below the long-term ascending trendline and key horizontal support near ₹3,500, signaling potential trend weakness. Weekly candle closed below support with above-average volume, confirming breakdown pressure. 🔹 Technical Observations Pattern: Breakdown from rising trendline support. Volume: Selling volume expansion visible during the breakdown week. RSI: Currently at ~40, showing bearish momentum and no immediate divergence. MACD: Negative crossover below the zero line — trend momentum has turned bearish. Structure: Lower highs and breakdown from higher low pattern indicate shift from uptrend to corrective phase. 🔹 Key Levels Immediate Resistance: ₹3,505 Major Resistance: ₹3,700 Immediate Support: ₹3,184 Major Support: ₹2,990 🔹 Strength & Risk ✅ Long-term structure still above ₹2,990, which acts as a major swing support. ✅ Stock could find temporary relief near ₹3,184–₹2,990 zone. ❌ Breakdown below major trendline with volume — caution warranted. ❌ RSI and MACD show continued bearish momentum, no reversal signals yet. 🔹 Outlook Short Term: Weak to sideways; likely to test support at ₹3,180–₹3,000. Medium Term: Any bounce toward ₹3,500–₹3,700 may face supply pressure. Risk: Sustained close below ₹2,990 can extend downside toward ₹2,700–₹2,600. 📌 Strategy Traders: Avoid fresh long positions until stock reclaims ₹3,500 levels. Investors: Watch for price stability near ₹3,000 zone before considering re-entry. Stop-Loss: Maintain SL below ₹2,980 for any positional holds. 📢 Disclaimer: This is for educational purposes only, not investment advice. 🧑‍💼 Rajneesh Sharma – SEBI Registered Research Analyst (INH000020332)

#TechnicalViews
Screenshot 2025-10-06 165126.png
456 likes·82 comments