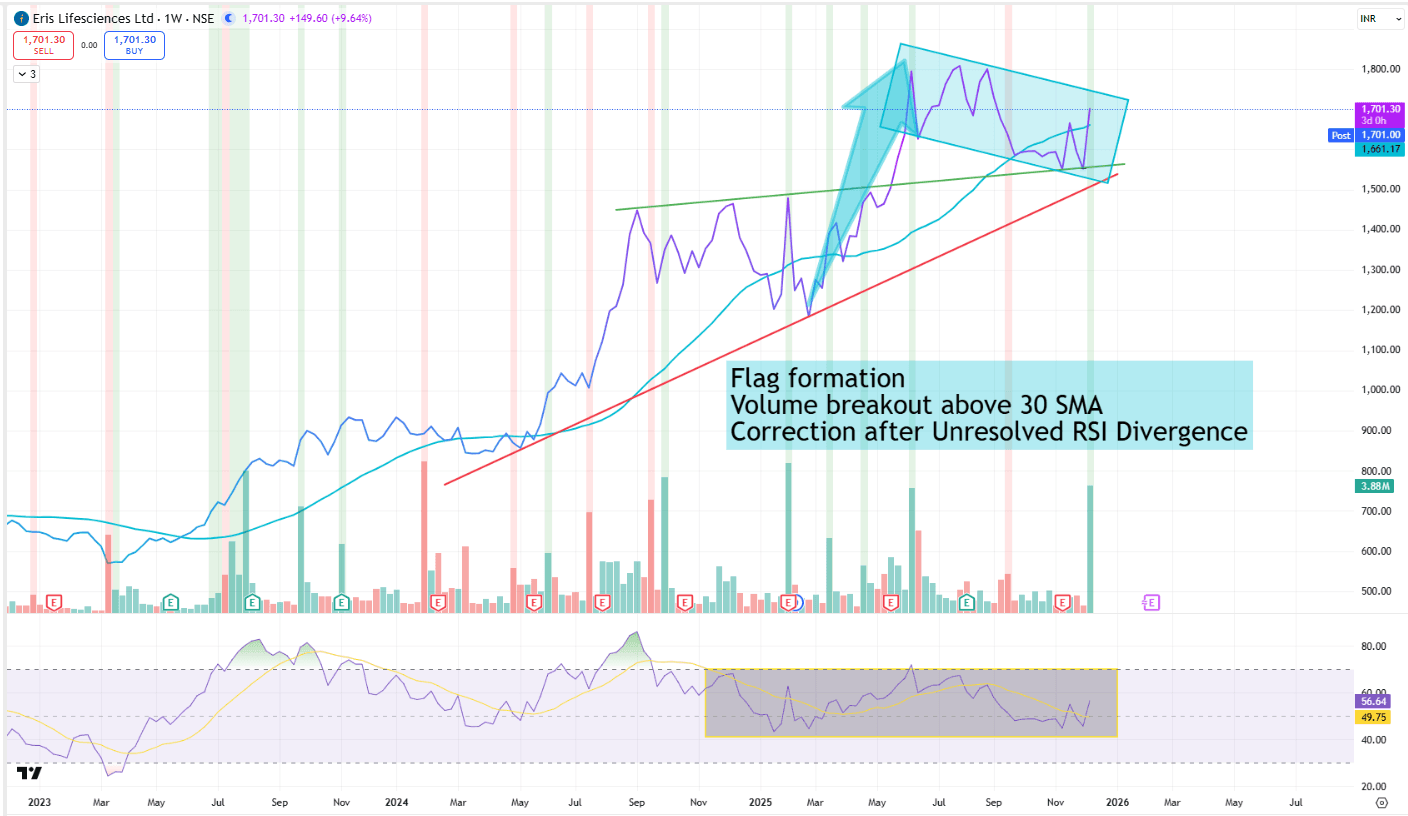
Eris Lifesciences – Flag Formation With Volume Breakout Above 30W SMA
ERIS
1. Clear Flag Pattern in Formation
Eris Lifesciences is currently forming a classic bullish flag pattern, a continuation structure often seen mid-trend.
Strong pole (sharp rally)
Sideways–downward consolidation inside a channel
Price respecting upper and lower boundaries
This indicates healthy consolidation rather than distribution.
2. Breakout With Volume Above 30-Week SMA
Price has decisively moved above the 30-week SMA, supported by a noticeable volume surge.
Volume expanding strengthens breakout validity
Sustains long-term uptrend structure
Indicates renewed institutional participation
3. Prior RSI Bearish Divergence Corrected
RSI previously showed bearish divergence, hinting at overextension.
The correction inside the flag has neutralized that divergence:
RSI stabilized within a long consolidation band
No fresh negative divergence currently
RSI now trending back toward the 60 zone → bullish zone entry
4. Price Holding Above Long-Term Trendline
The chart shows price respecting the multi-year rising trendline (red/green lines).
Higher-low structure remains intact
Trendline support held even during corrective phase
Signals broader uptrend remains healthy
5. Setup Turning Strong But Needs Confirmation
The structure is constructive:
Breakout above 30W SMA
Strong volume
Flag nearing upper boundary
RSI improving
Next Key Trigger:
📌 A weekly close above the upper flag line → trend continuation toward previous highs.
📢 Disclaimer: For educational and technical analysis purposes only; not investment advice.
👤 Rajneesh Sharma – SEBI Registered Research Analyst (INH000020332)