
‹ All Posts
Rajneesh Sharma CFTe

24th Jan · SEBI-Registered Analyst

Jindal Poly Investment & Finance Co. Ltd – Weekly Rangebound Structure with Channel Interaction
JPOLYINVST
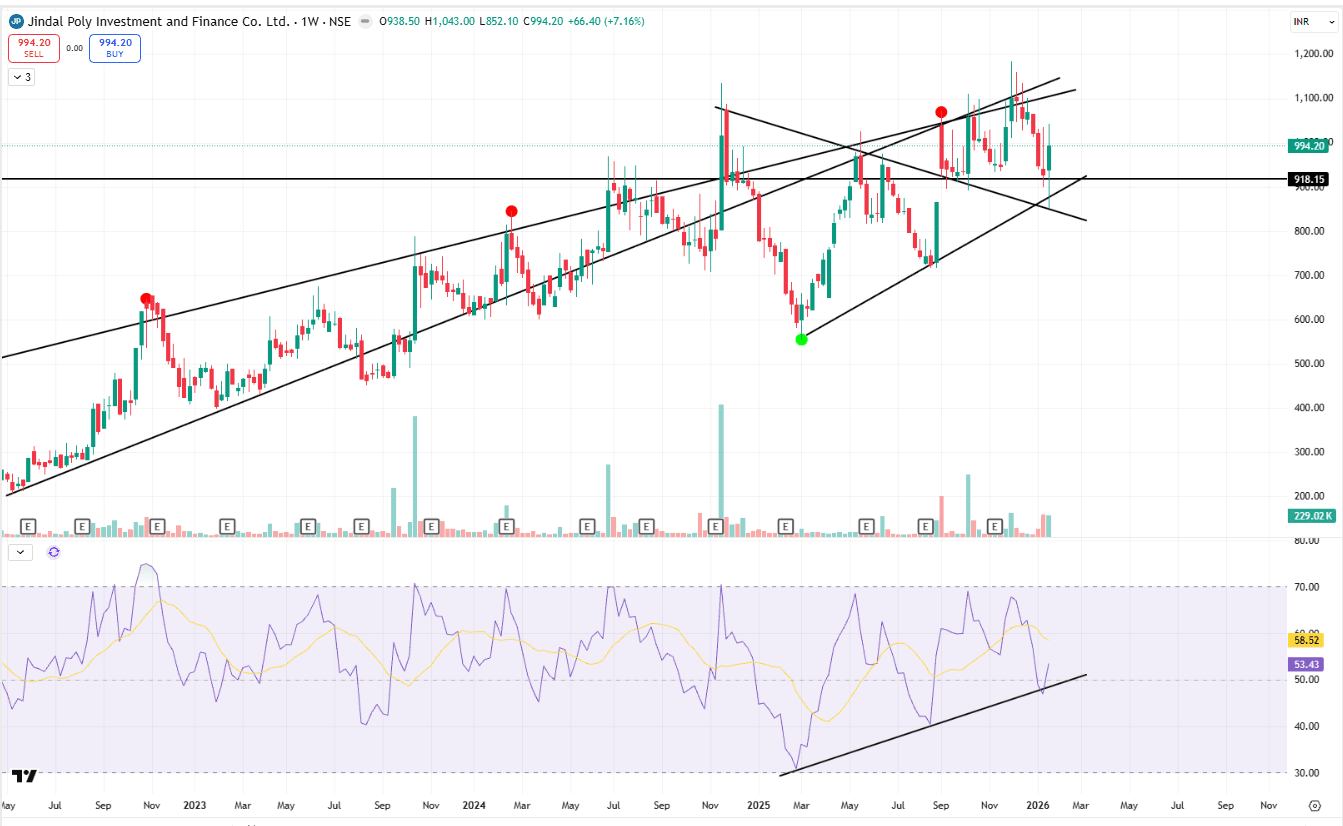
🧭 Weekly Chart Context The stock continues to trade within a broad rising structure formed over multiple years. Recent price action shows compression after a volatile swing, with price oscillating around a key horizontal zone near prior congestion. 🔎 Key Technical Observations Price Structure: Long-term uptrend remains intact, but recent candles show hesitation after a sharp upswing and pullback. The price is moving within intersecting trendlines, indicating loss of directional clarity in the near term. Trendlines & Channels: The stock has respected rising support lines historically, but recent interaction with overlapping trendlines suggests a transition from trending to consolidation behavior. Support–Resistance Behavior: Price is hovering near a well-tested horizontal zone, which has acted as both resistance and support in the past, reinforcing its importance. RSI Structure: RSI is holding above mid-range levels and is gradually rising from a higher base, indicating underlying strength despite price consolidation. Momentum Tone: Momentum has cooled after the prior advance, reflecting digestion of earlier gains rather than aggressive distribution. Volume Character: Volume spikes are intermittent and not expanding consistently, supporting the view of a consolidation phase rather than a fresh impulsive move. 🧩 Interpretation The chart reflects a stock in structural balance after a strong multi-leg move. While the broader trend remains constructive, overlapping trendlines and muted momentum suggest consolidation is underway. Directional clarity is likely to emerge once this compression phase resolves. 📢 Disclaimer: For educational and technical analysis purposes only; not investment advice. 👤 Rajneesh Sharma – SEBI Registered Research Analyst (INH000020332)

#TechnicalViews
Screenshot 2026-01-24 175811.png
474 likes·53 comments