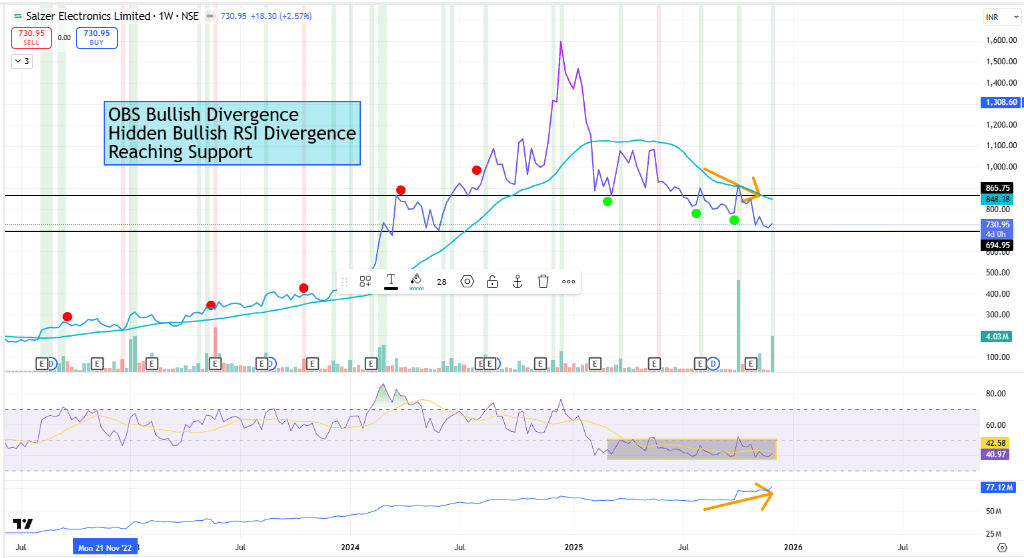
Salzer Electronics – Converging Bullish Divergences at Major Support
SALZERELEC
1. Price Testing a Strong Multi-Month Support Zone
Price is revisiting the ₹690–₹730 support area, previously defended multiple times (green dots).
This zone has consistently acted as a demand pocket, attracting buyers on retests.
2. OBV (On-Balance Volume) Bullish Divergence
While price has been making equal or slightly lower lows, OBV has been sloping upward.
This indicates accumulation beneath the surface, a constructive signal despite price weakness.
3. Hidden Bullish RSI Divergence
Price formed higher lows, whereas RSI printed lower lows inside the highlighted box.
Hidden bullish divergence often appears during corrections in larger uptrends, suggesting underlying strength.
4. Declining Momentum But Flattening Out
RSI has been stuck in a sideways compression zone.
Momentum is stabilizing, often a precursor to a shift in trend—especially when combined with support and divergences.
5. Volume Spike After Long Consolidation
A recent surge in volume hints that demand is returning right as price tests support, improving the probability of a bullish reaction.
📌 Summary View
Salzer Electronics shows an interesting setup with multiple bullish divergences (OBV + Hidden RSI), all aligning exactly at a well-tested support zone. Although price remains under a short-term trendline resistance, the internal strength suggests the downside may be getting exhausted.
📢 Disclaimer: For educational and technical analysis purposes only; not investment advice.
👤 Rajneesh Sharma – SEBI Registered Research Analyst (INH000020332)