1 hour ago · SEBI Registration INH000032382
SEBI Registration INH000032382 · 1 hour ago
HDFC Bank Ltd Technical Research Outlook with Key Levels
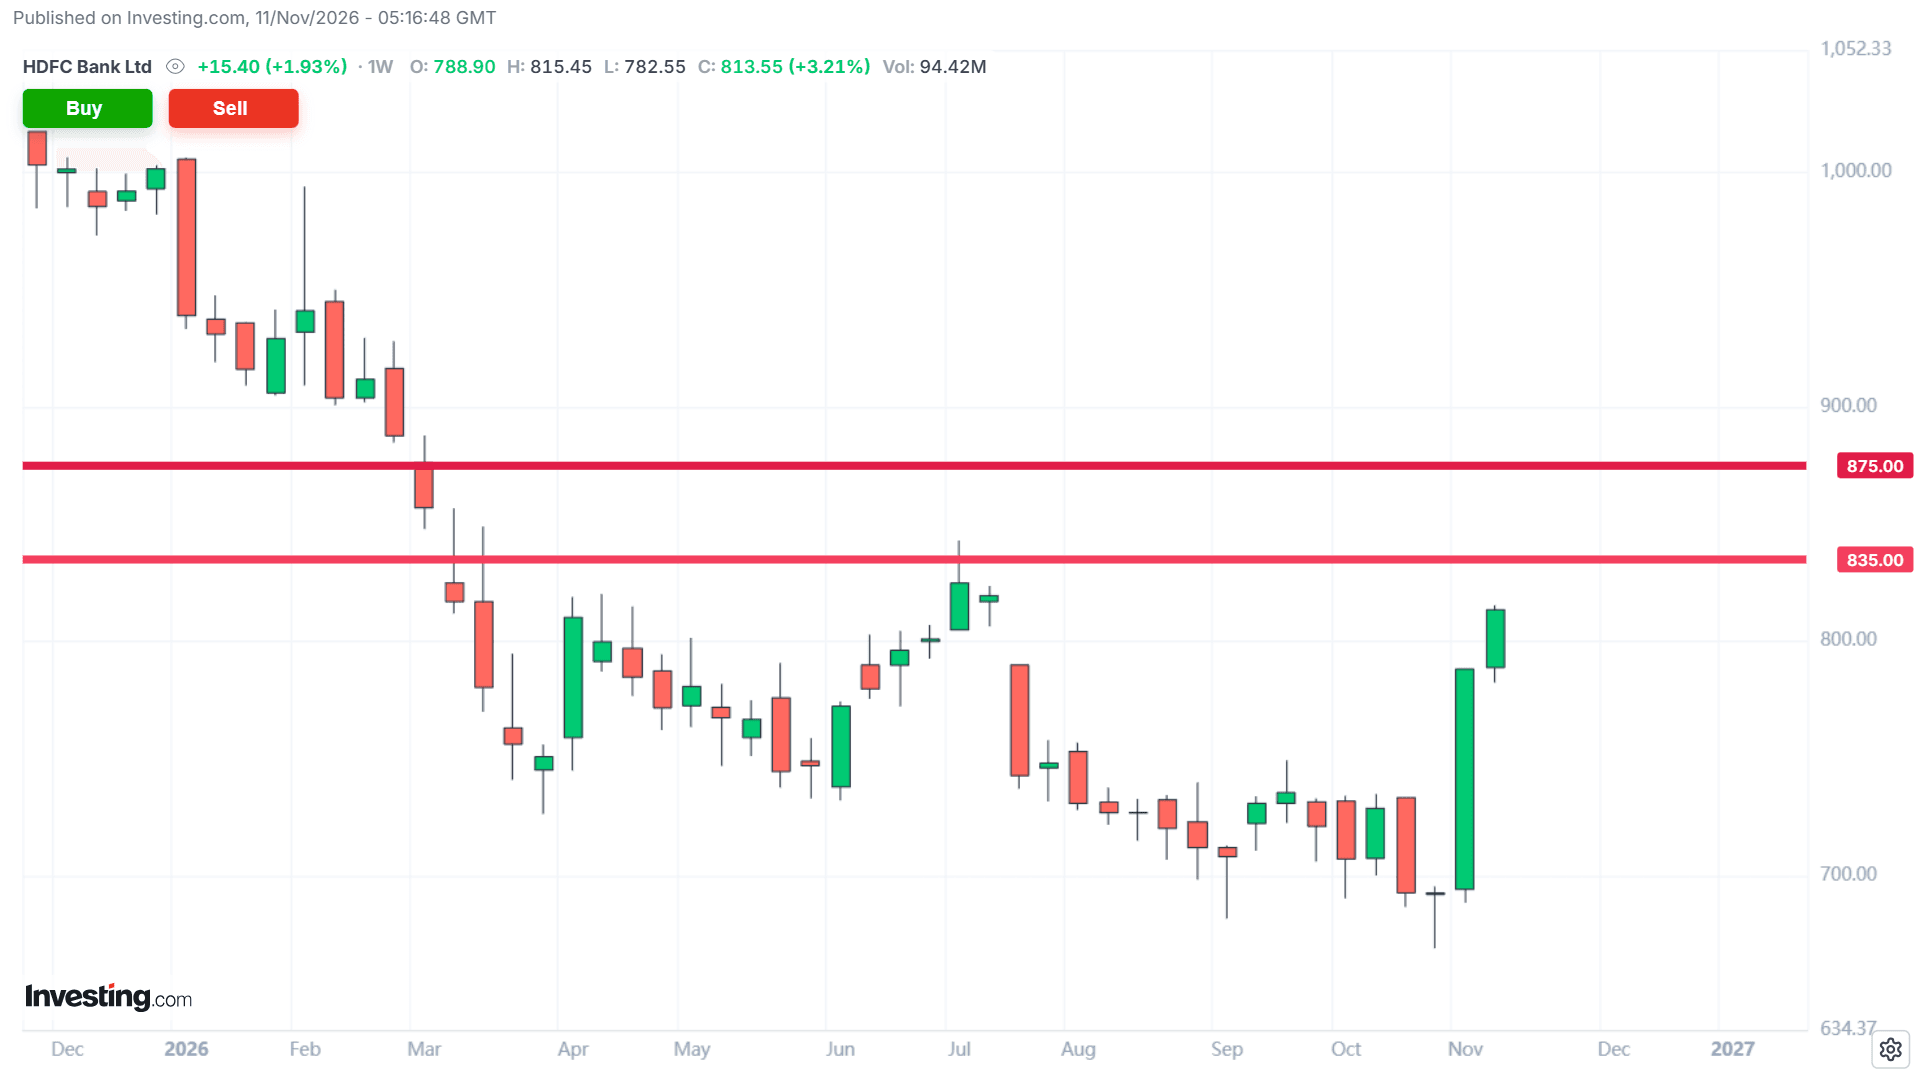
HDFC Bank Limited is currently exhibiting a corrective bounce within a broader bearish technical structure, with price action approaching a critical supply zone. An analysis of the uploaded chart indicates that the recent upward momentum is likely to encounter substantial overhead supply, specifically within the major resistance band of 835 to 875 levels. This historical resistance zone has previously acted as a strong distribution area, and current chart patterns suggest that significant selling pressure will resume once the price enters this territory, potentially pushing the stock back downwards. Market participants should exercise extreme caution and avoid aggressive buying at these elevated levels to prevent getting trapped in a sudden trend reversal to the downside. A more prudent strategy involves waiting for clear price rejection signals near the 835 to 875 range to initiate short positions or maintain a neutral stance until the stock tests lower support thresholds. With current trading levels hovering near the 798 mark, the risk-reward ratio for fresh long positions remains highly unfavorable. It is imperative for traders to protect capital, strictly manage risk, and anticipate a bearish pivot as the stock tests its upper resistance boundaries in the upcoming sessions. Please Read Disclaimer & Disclosure Carefully: *****