What This Means for DATAMATICS?
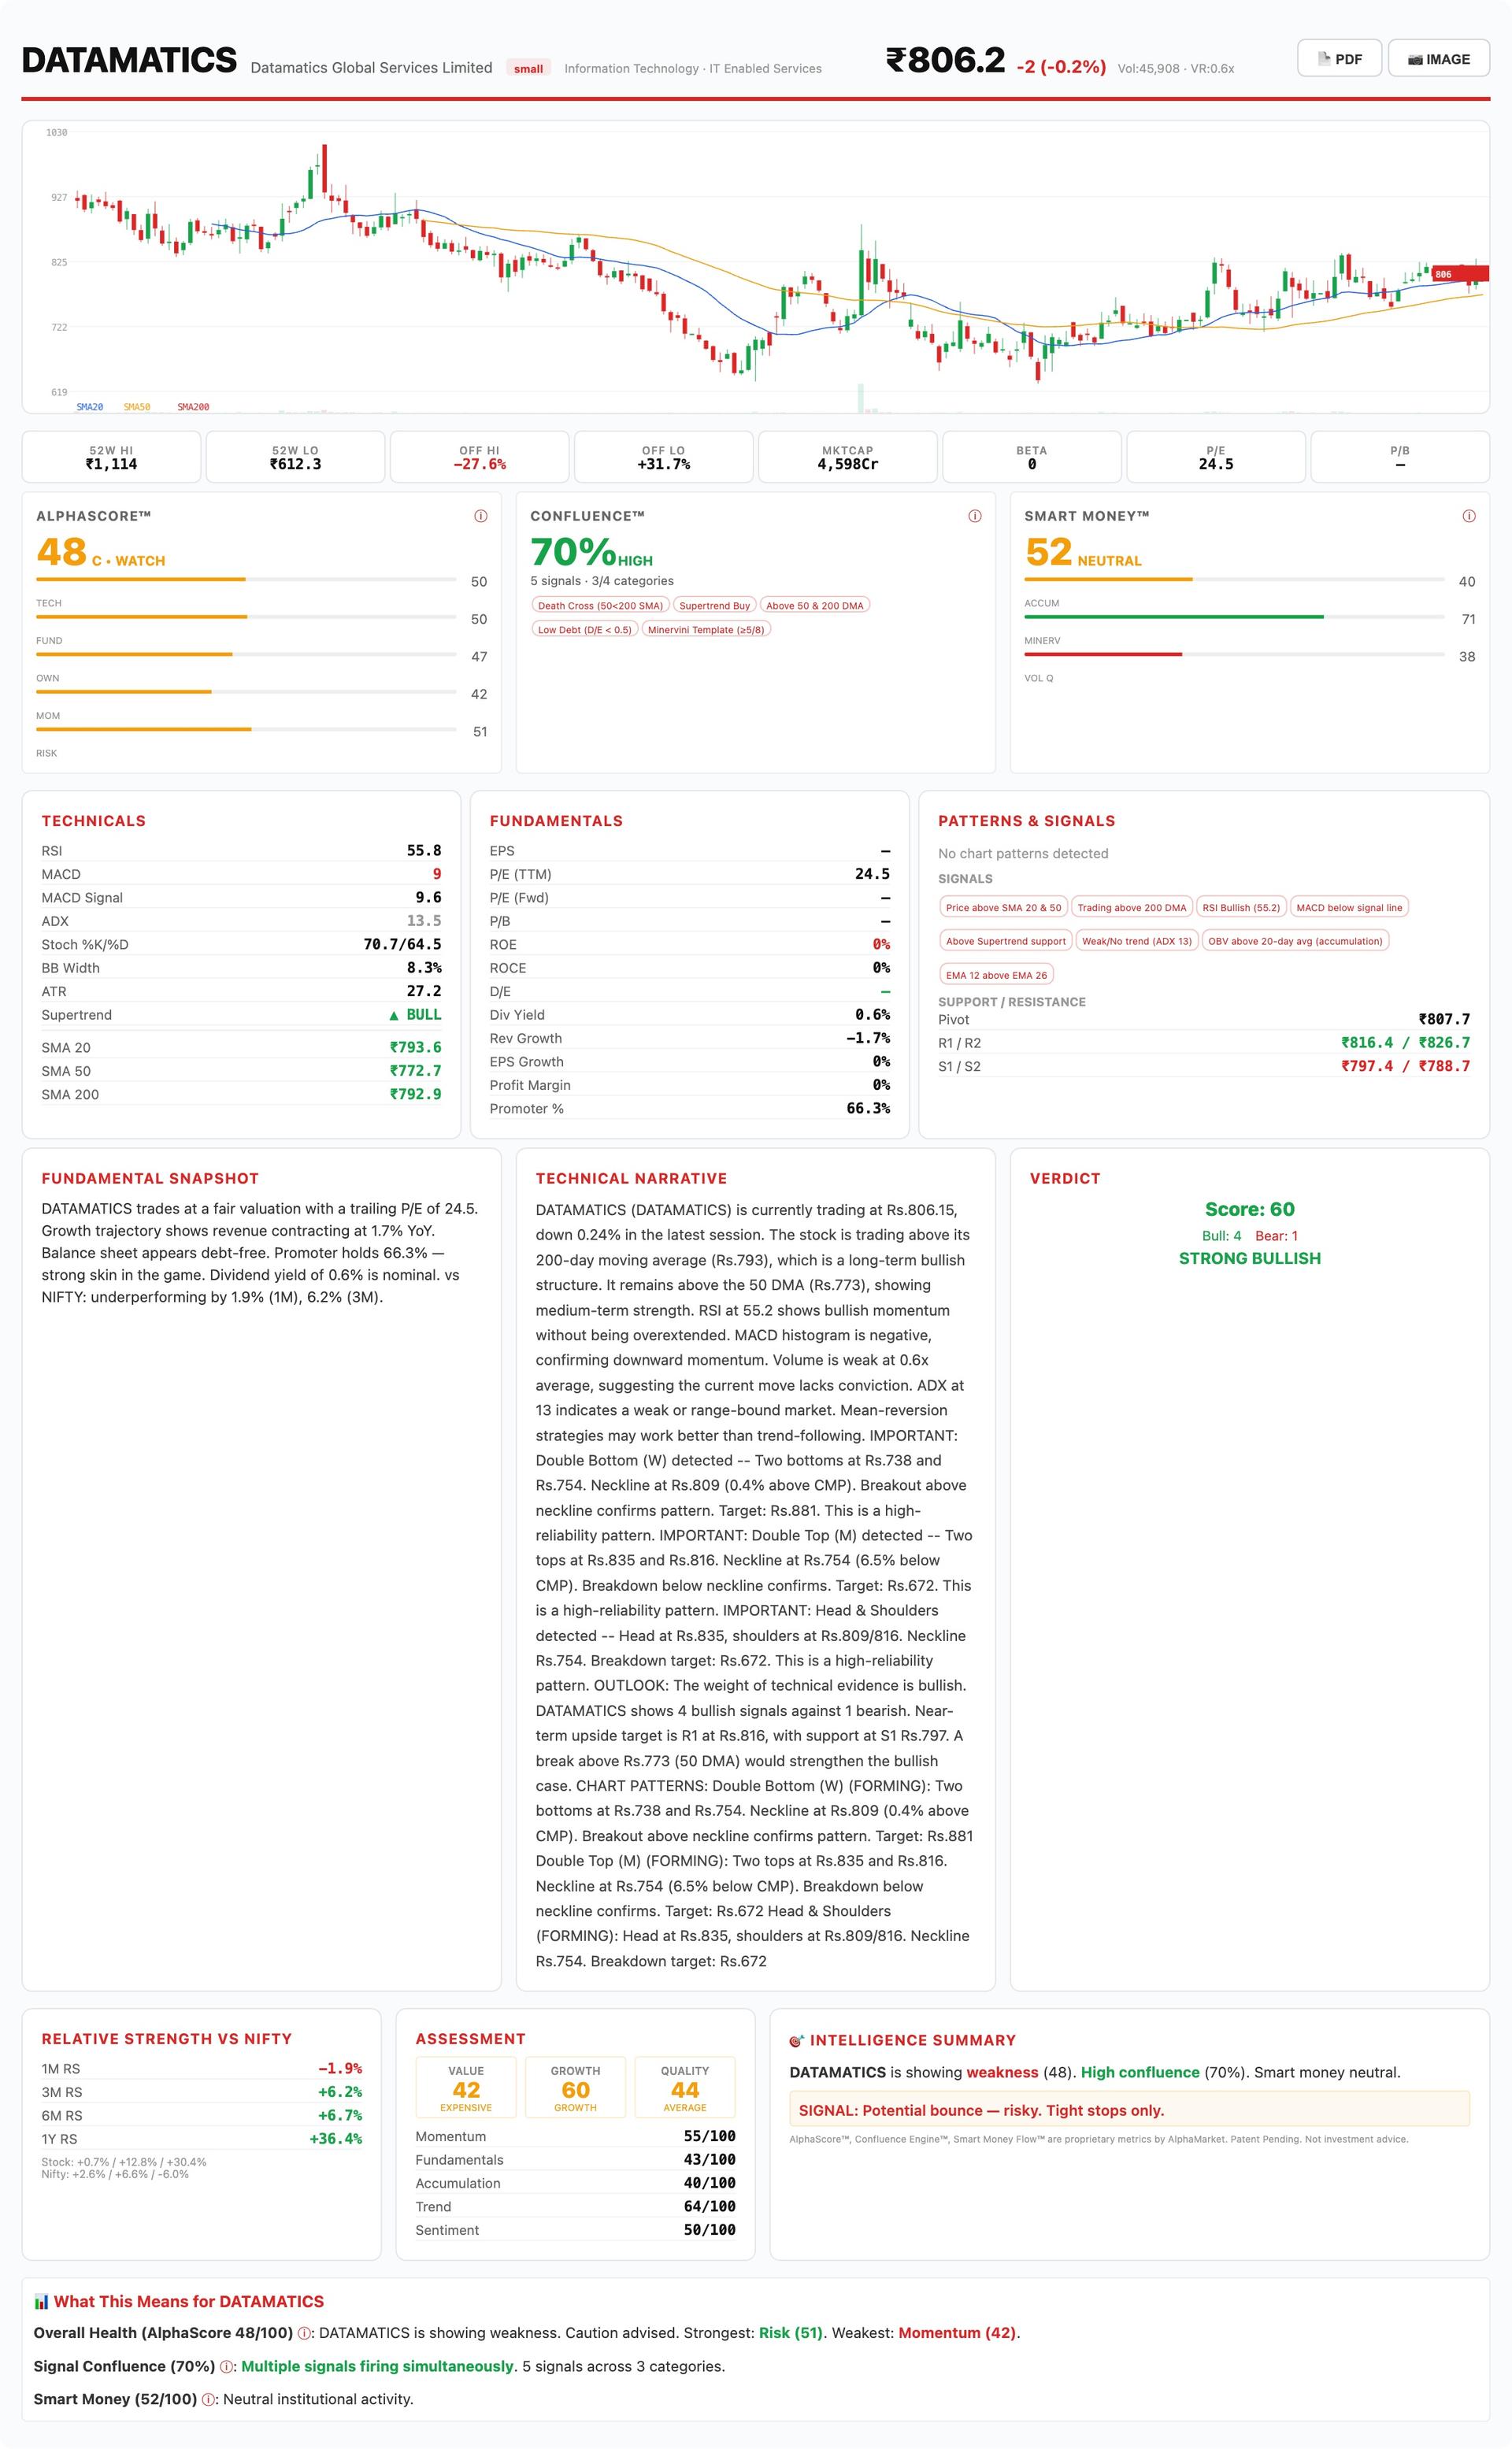
DATAMATICS ( $DATAMATICS ) is currently trading at Rs.806.15, down 0.24% in the latest session. The stock is trading above its 200-day moving average (Rs.793), which is a long-term bullish structure. It remains above the 50 DMA (Rs.773), showing medium-term strength. RSI at 55.2 shows bullish momentum without being overextended. MACD histogram is negative, confirming downward momentum. Volume is weak at 0.6x average, suggesting the current move lacks conviction. ADX at 13 indicates a weak or range-bound market. Mean-reversion strategies may work better than trend-following. IMPORTANT: Double Bottom (W) detected -- Two bottoms at Rs.738 and Rs.754. Neckline at Rs.809 (0.4% above CMP). Breakout above neckline confirms pattern. Target: Rs.881. This is a high-reliability pattern. IMPORTANT: Double Top (M) detected -- Two tops at Rs.835 and Rs.816. Neckline at Rs.754 (6.5% below CMP). Breakdown below neckline confirms. Target: Rs.672. This is a high-reliability pattern. IMPORTANT: Head & Shoulders detected -- Head at Rs.835, shoulders at Rs.809/816. Neckline Rs.754. Breakdown target: Rs.672. This is a high-reliability pattern. OUTLOOK: The weight of technical evidence is bullish. DATAMATICS shows 4 bullish signals against 1 bearish. Near-term upside target is R1 at Rs.816, with support at S1 Rs.797. A break above Rs.773 (50 DMA) would strengthen the bullish case. CHART PATTERNS: Double Bottom (W) (FORMING): Two bottoms at Rs.738 and Rs.754. Neckline at Rs.809 (0.4% above CMP). Breakout above neckline confirms pattern. Target: Rs.881 Double Top (M) (FORMING): Two tops at Rs.835 and Rs.816. Neckline at Rs.754 (6.5% below CMP). Breakdown below neckline confirms.