


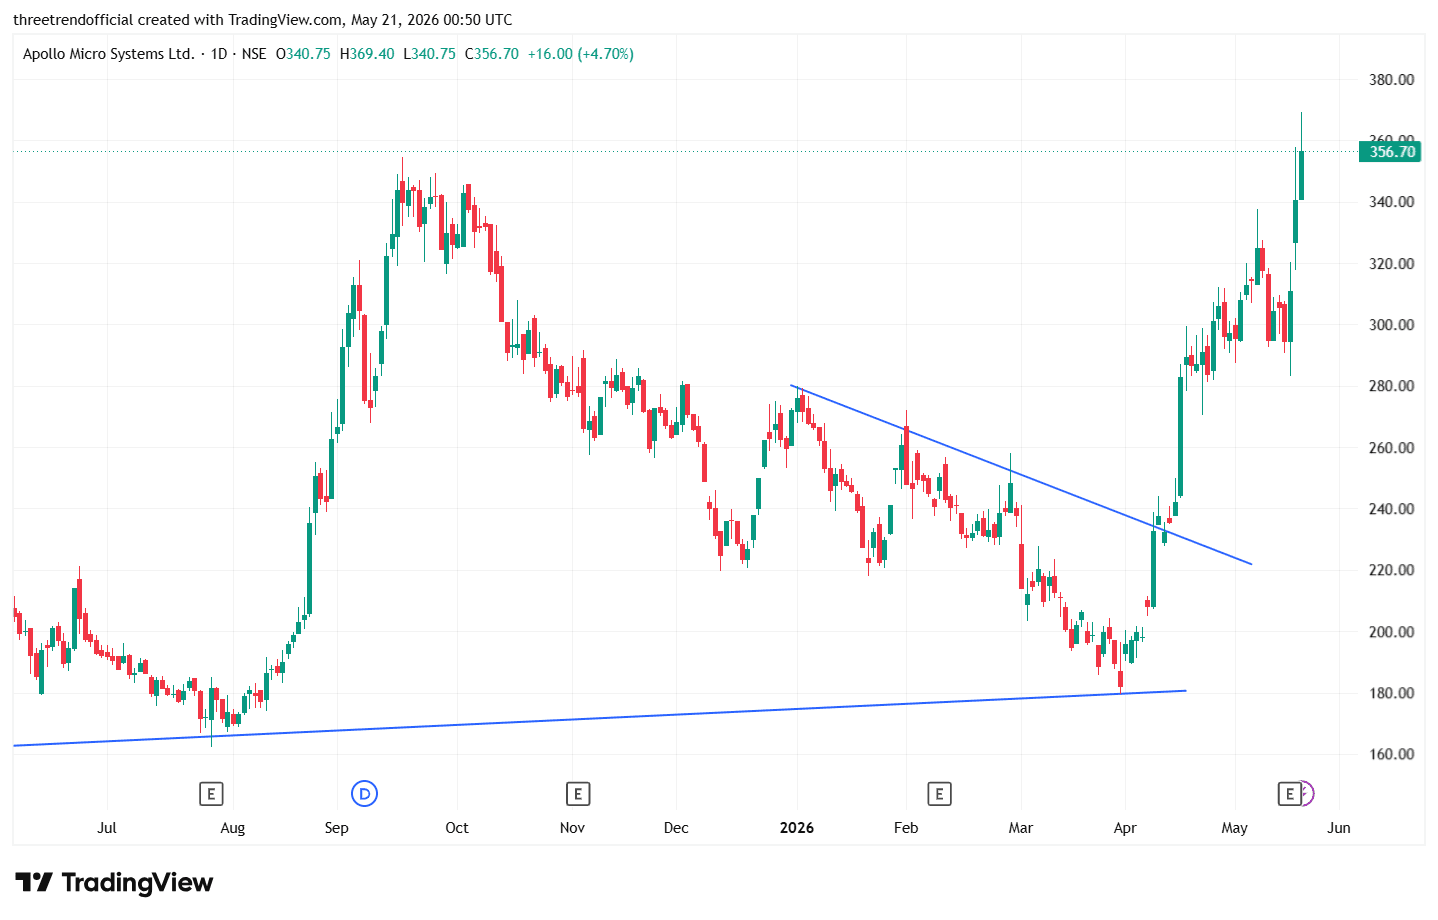
$APOLLO An ascending triangle is a bullish chart pattern formed when the price creates higher lows while facing resistance at a horizontal level. It shows that buyers are becoming stronger and gradually pushing the price upward, while sellers defend a fixed resistance zone. As the range narrows, buying pressure increases, and a breakout above the resistance level often leads to a strong upward move with higher trading volume. Traders generally consider this pattern a continuation signal in an uptrend and use the breakout level as a potential entry point.
#TechnicalViews#FundamentalViews
411 likes·65 comments