


22nd Nov · SEBI Registration INH000022729
SEBI Registration INH000022729 · 22nd Nov
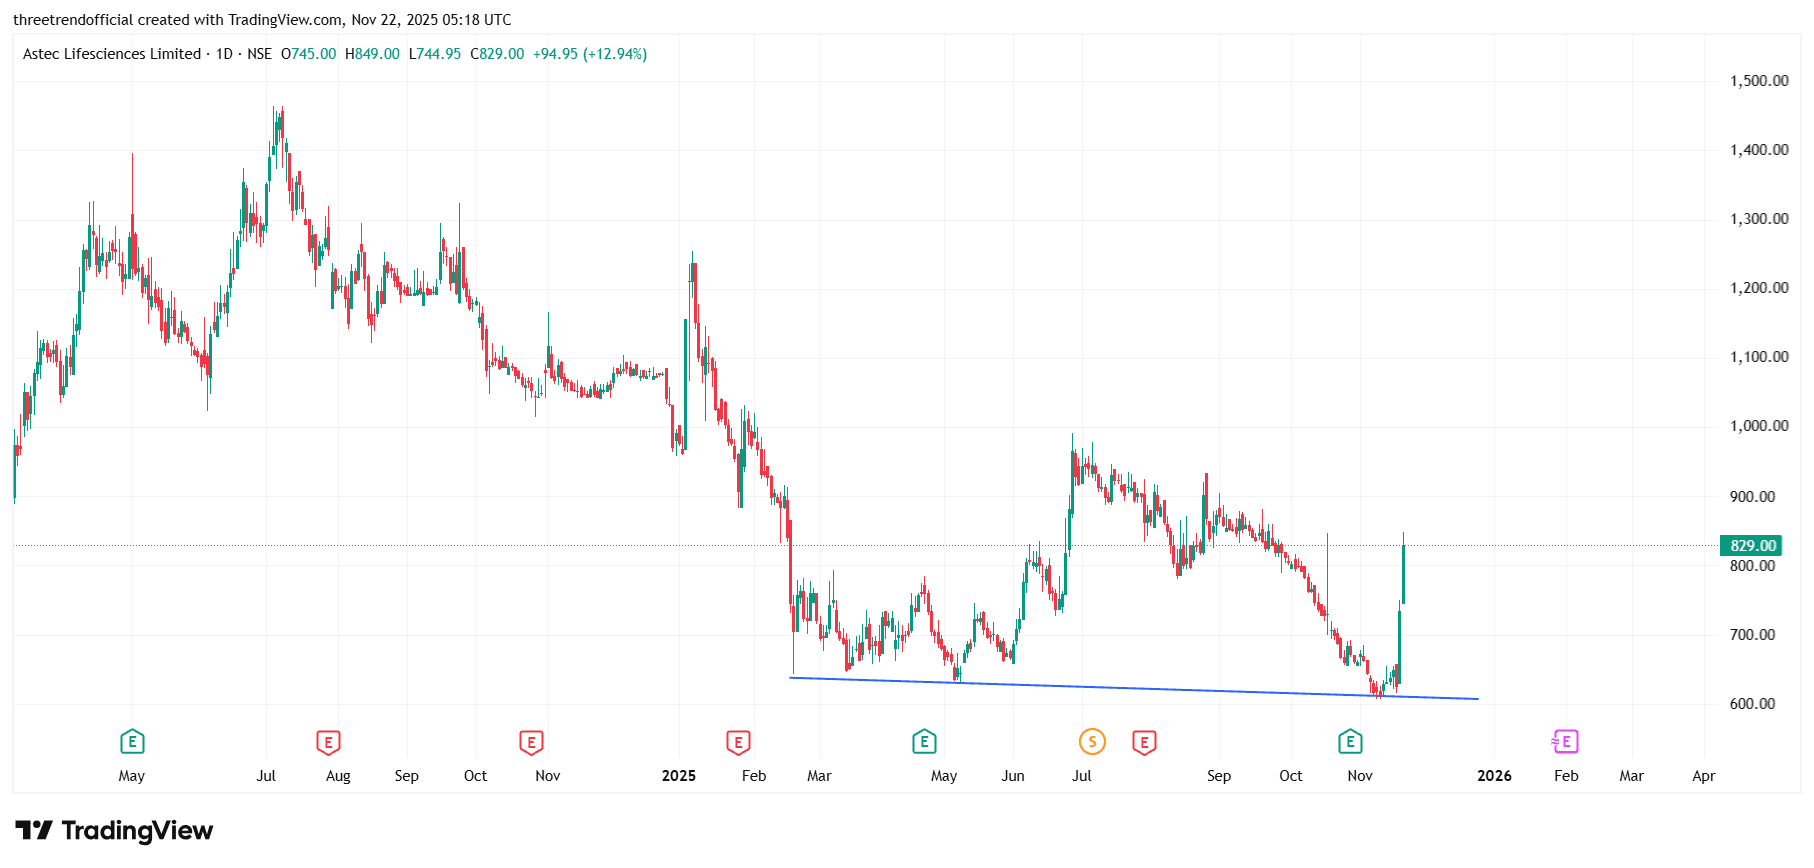
ASTEC Astec Lifesciences on the daily chart shows a long falling trend that eventually stabilized into a broad descending support zone, where price consistently created higher lows on the trendline despite overall weakness. After testing this support again recently, the stock formed a strong bullish reversal candle with heavy volume, signalling that buyers have aggressively defended the support and initiated a sharp rebound. This breakout from the recent consolidation indicates a shift in momentum, and as long as the price holds above the 700–720 zone, the structure remains constructive with potential for further upside recovery.
#FundamentalViews#TechnicalViews
529 likes·49 comments