1 hour ago · SEBI Registration INH000022729
SEBI Registration INH000022729 · 1 hour ago
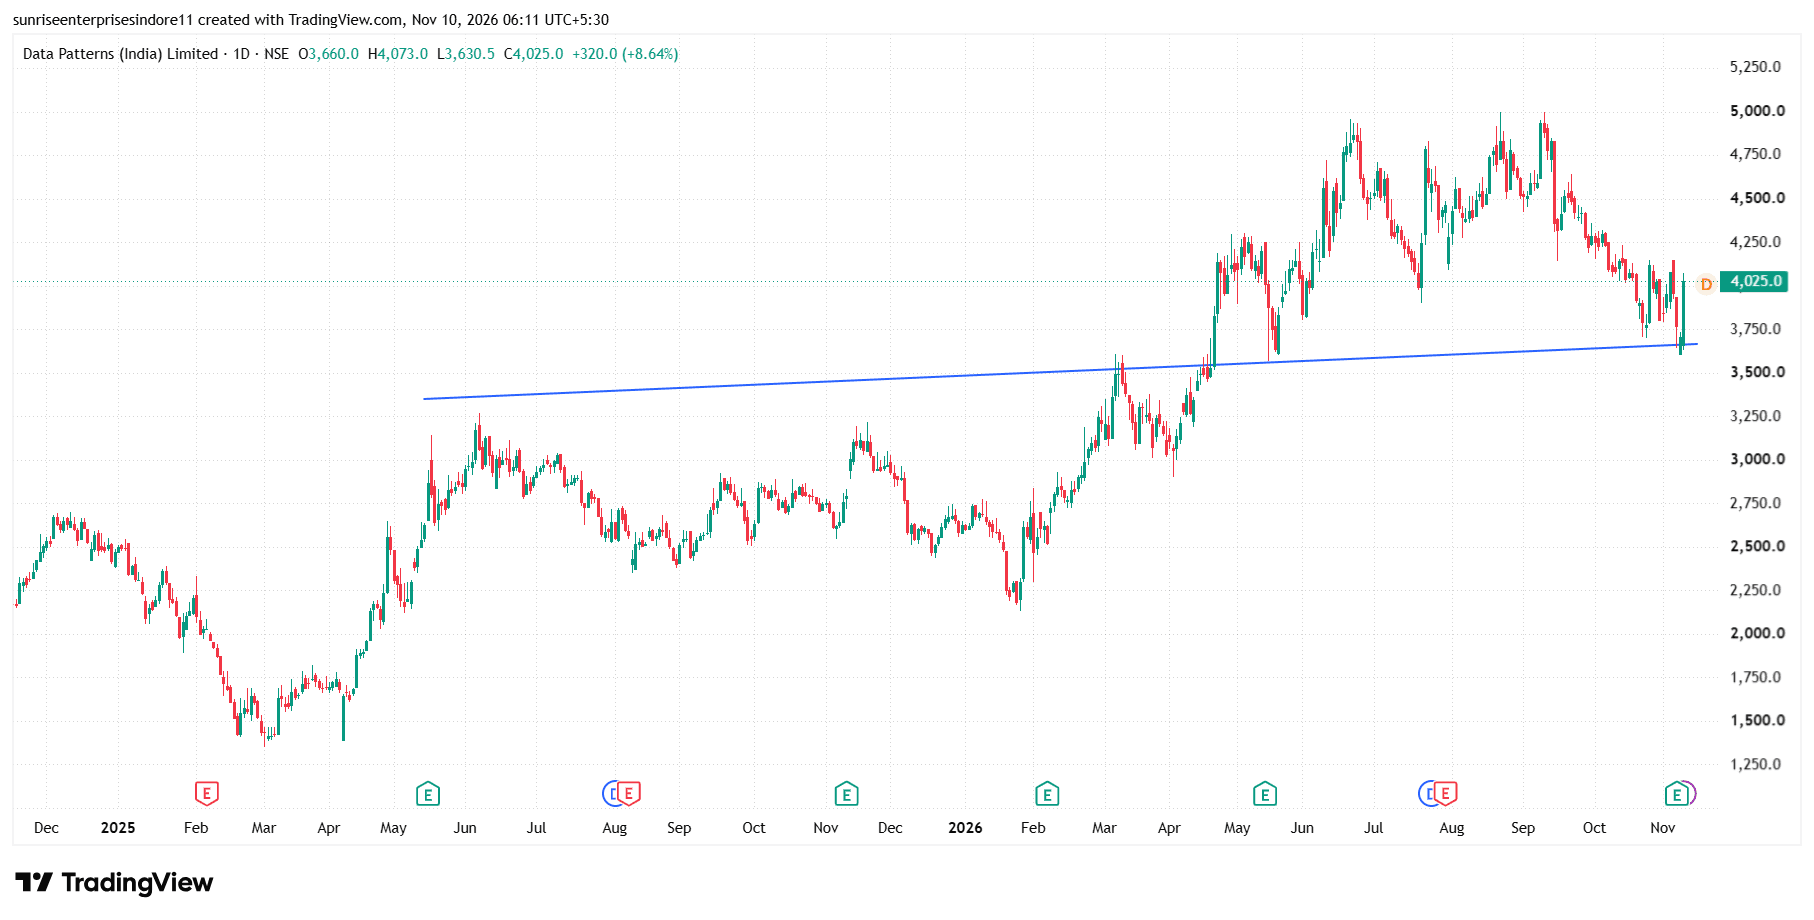
Data Patterns is showing an interesting example of trendline
DATAPATTNS Data Patterns is showing an interesting example of trendline support and price retracement from a long-term rising support zone. After witnessing a strong rally, the stock entered a corrective phase and gradually moved down towards its previous rising trendline support, where buying interest emerged. The important concept here is that a rising trendline connects previous higher lows and acts as a dynamic support zone, indicating that buyers are consistently entering the market at higher price levels. Recently, the stock tested the ₹3,650–₹3,750 support area and witnessed a strong bounce-back, suggesting that sellers are losing momentum while buyers are attempting to regain control. Today's strong bullish candle, with an approximately 8.64% gain, adds strength to the recovery and indicates a possible reversal from the support zone. If the stock sustains above this trendline and starts forming higher lows, it could signal a fresh upward move. However, traders should watch for follow-through buying and volume confirmation, as a decisive breakdown below the trendline could invalidate this bullish setup.