1 hour ago · SEBI Registration INH000022729
SEBI Registration INH000022729 · 1 hour ago
On the daily chart, RBL Bank is showing signs of recovery
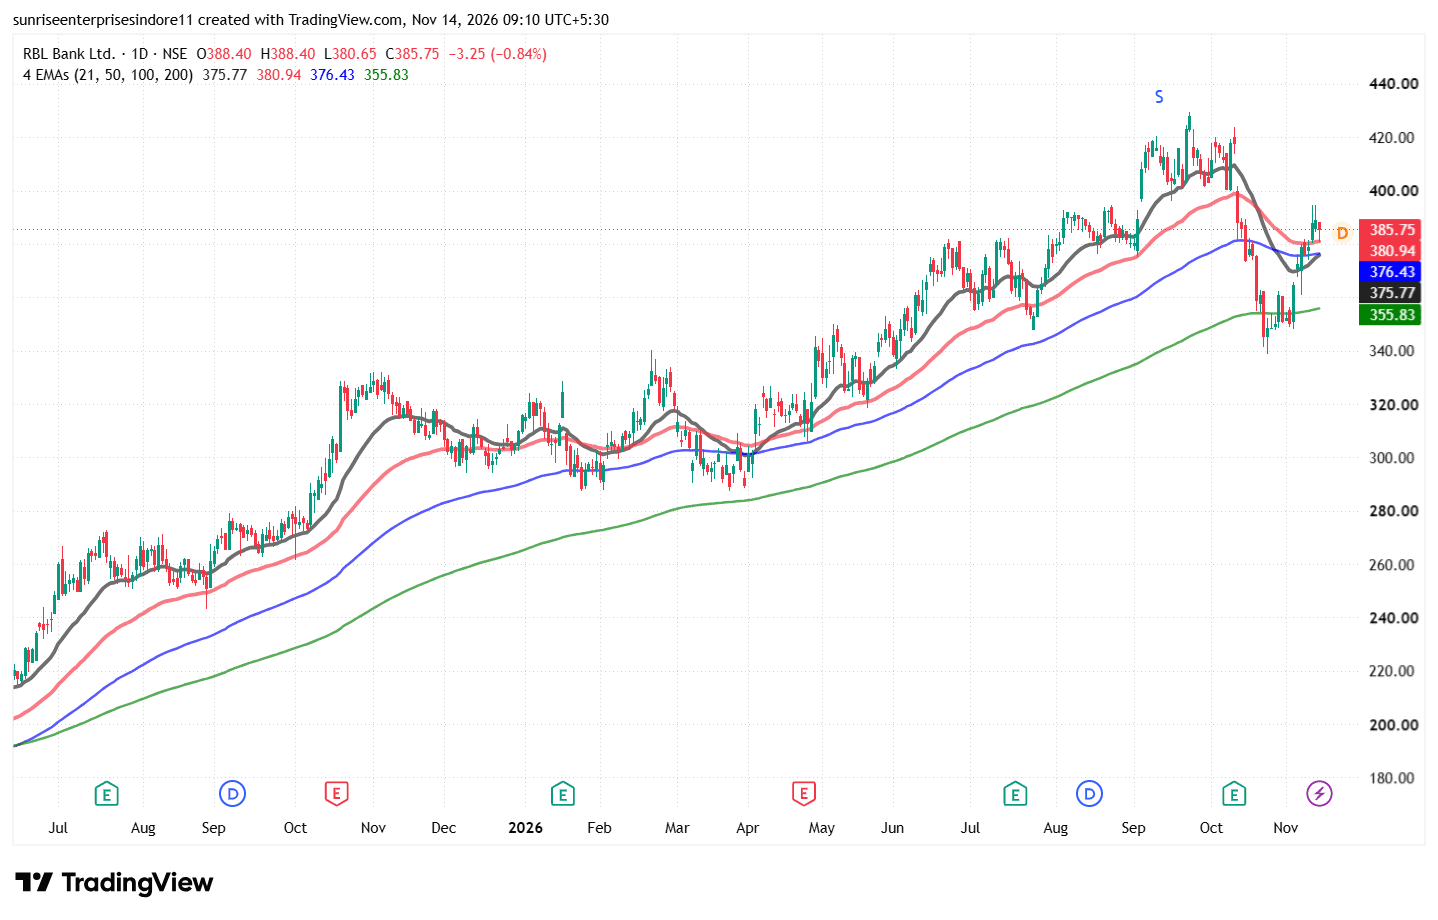
RBLBANK On the daily chart, RBL Bank is showing signs of recovery after a sharp correction from the ₹420–430 zone. The stock has rebounded from the ₹345–350 support area and is currently trading around ₹385.75, above its 21 EMA (₹375.77), 50 EMA (₹380.94), 100 EMA (₹376.43) and 200 EMA (₹355.83). This indicates improving short-term momentum and a potential trend-reversal attempt. The ₹375–380 zone is an important support area, while ₹395–400 and ₹420 are the next resistance zones. Sustaining above all four EMAs with strong volumes could strengthen the bullish structure, although confirmation is important as the stock is still recovering from its previous decline. Fundamentally, RBL Bank has reported encouraging Q2 FY27 results, with net profit rising 170% YoY to ₹482 crore, while Net Interest Income (NII) increased 37% to ₹2,131 crore and Net Interest Margin improved to 4.61%. Advances grew 42% and deposits increased 34% year-on-year, indicating strong business expansion. Asset quality also improved, with Gross NPA declining to 1.02% from 2.32% a year ago. However, investors should monitor unsecured retail loan slippages, higher provisions and the declining CASA ratio. Overall, improving profitability, asset quality and business growth provide positive fundamental support, while sustained price action above the EMAs will be important for technical confirmation.