


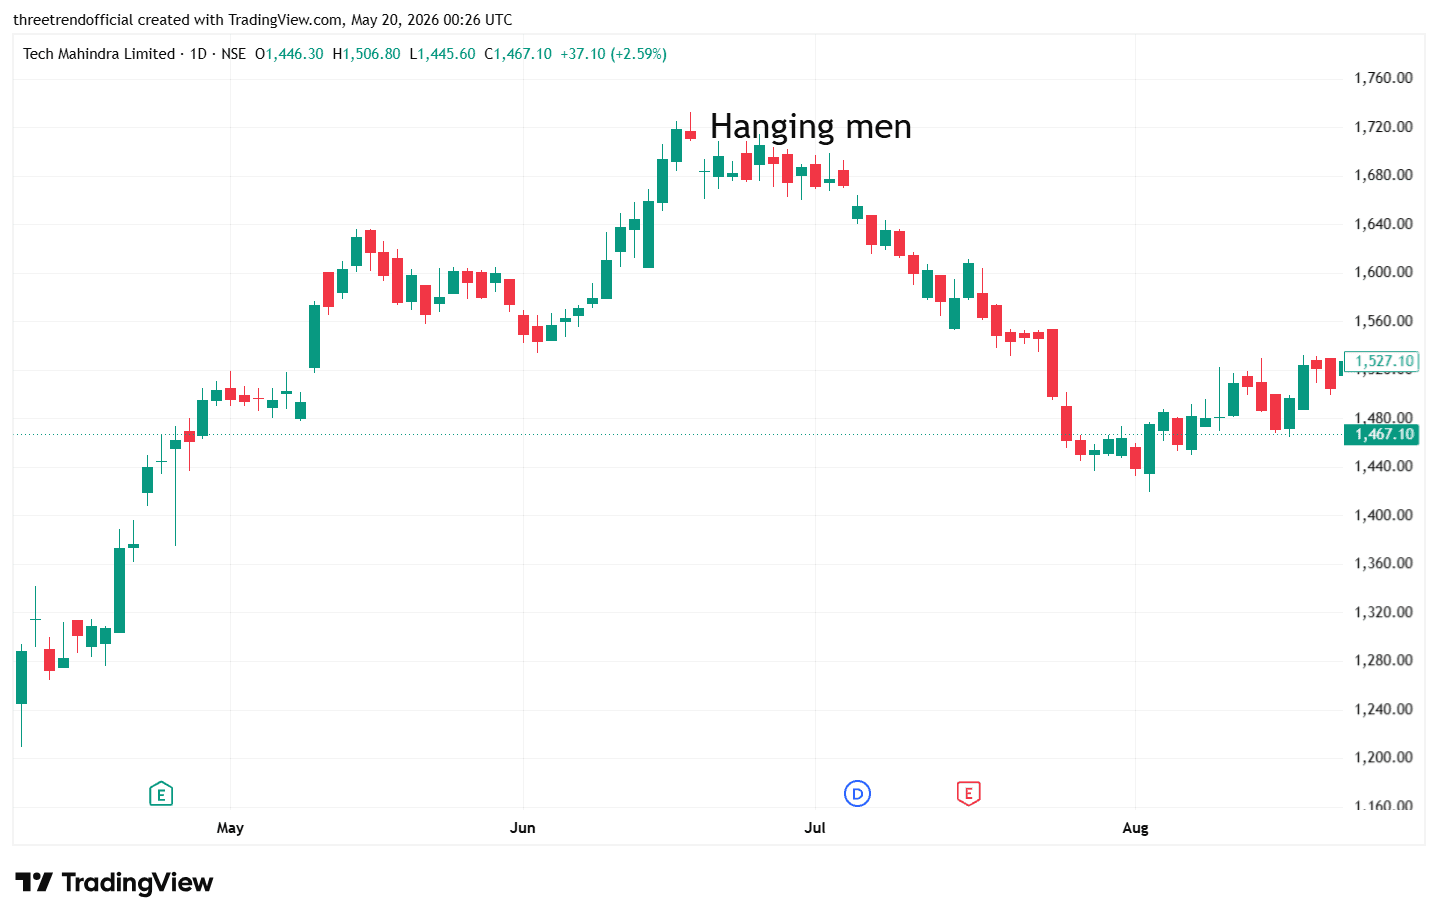
$TECHM The Hanging Man pattern is a bearish reversal candlestick pattern that appears after an uptrend. It has a small real body at the top with a long lower shadow, showing selling pressure during the session. Although buyers recover prices near the close, the pattern signals weakening bullish momentum. Confirmation with a bearish candle in the next session increases the chances of a downward reversal.
#TechnicalViews#FundamentalViews
1,103 likes·74 comments